
Why you should know this
Survival depends on recognizing when a model’s assumptions no longer hold and when price history cannot answer a fundamental or operational question.
We are not looking for a magic signal. We are learning to read the chart together, define what would prove the idea wrong and keep the later decision reviewable.
The short answer
This lesson examines regime shifts, illiquidity, event shocks and model breakdown.
1. The data are wrong or incomplete

Bad ticks, missing candles, wrong time zones, stablecoin depegs, index changes and venue outages can corrupt indicators. If two reputable feeds disagree materially, the signal may be a data-quality problem.
Response: pause, preserve raw data, compare sources and document corrections. Do not trade through uncertainty just because an indicator printed a value.
2. Liquidity disappears

Technical levels assume some ability to transact near observed prices. In a thin or stressed market, spreads widen, books empty and stops slip. A pattern target can be irrelevant if the exit route fails.
Response: prioritize execution and operational risk. Reduce or avoid exposure under the prewritten rule; do not assume displayed quotes will return.
4. The regime changes
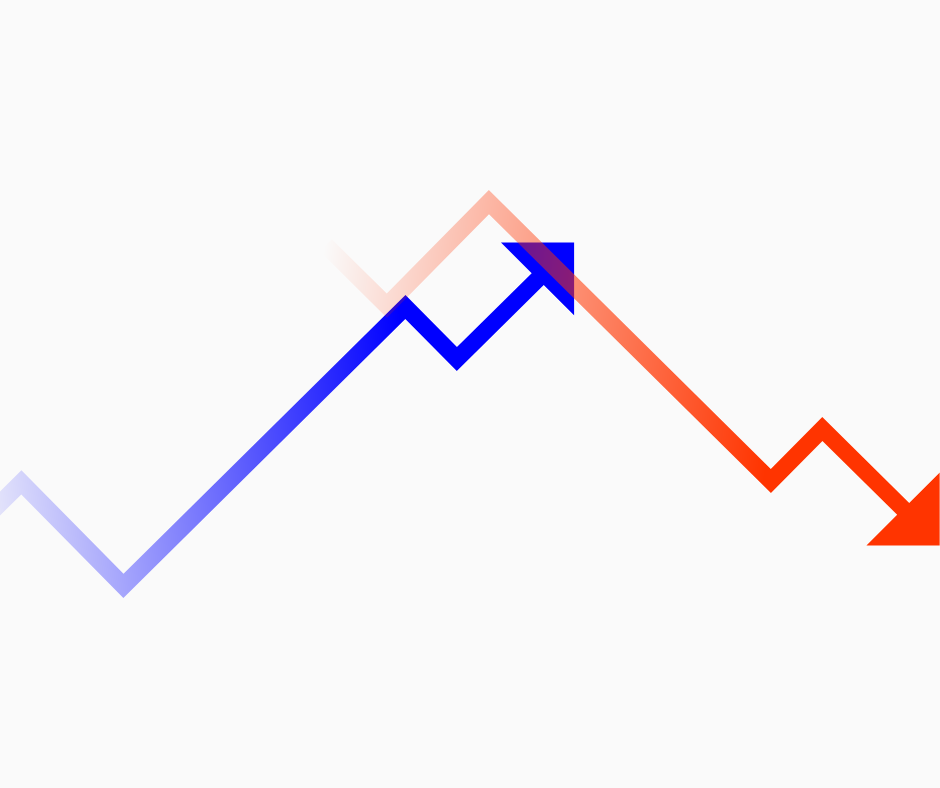
A trend model can whipsaw in a range; a mean-reversion model can fail in a sustained breakout. Correlation and volatility can shift.
Response: use predefined regime and transition rules. Do not change the label solely to protect the current position.
5. The strategy was overfit

If a rule depended on one asset, a precise parameter and a favorable backtest window, live failure may reveal selection bias rather than bad luck.
Response: review all experiments, untouched data, cost assumptions and parameter sensitivity. A failed model deserves investigation, not immediate optimization on the same sample.
A familiar Philippine or Asian example

A learner opens a historical BTC/USDT or BTC/PHP chart and records the venue, symbol, timeframe, time zone and candle-completion state. They mark one observation, one confirmation condition, one invalidation point and one alternative explanation. No live order is placed.
One risk or limitation
Technical tools summarize historical price, volume or derived data. They can lag, overfit and fail during regime changes, illiquidity, outages or news shocks. A chart pattern or indicator never guarantees direction, execution or profit.
How this connects to market mastery
Market mastery uses chart evidence conditionally. A useful technical plan states the context, confirmation, invalidation, cost and failure condition before any outcome is known.
Quick check — no money needed

Choose a historical chart with its symbol, venue and timeframe visible. Mark the setup’s context, observation, confirmation, invalidation and one common mistake. Explain what evidence would show that the tool is unreliable in this example.
If you can explain your answer and name the invalidation or main limitation, this lesson is complete.


