
Why you should know this
Support and resistance are hypotheses about areas of repeated interaction, not invisible walls.
The goal is not to prove that a tool “works.” The goal is to use one rule consistently enough that we can see when it helps, when it fails and when our own hindsight is doing the work.
Practice setup
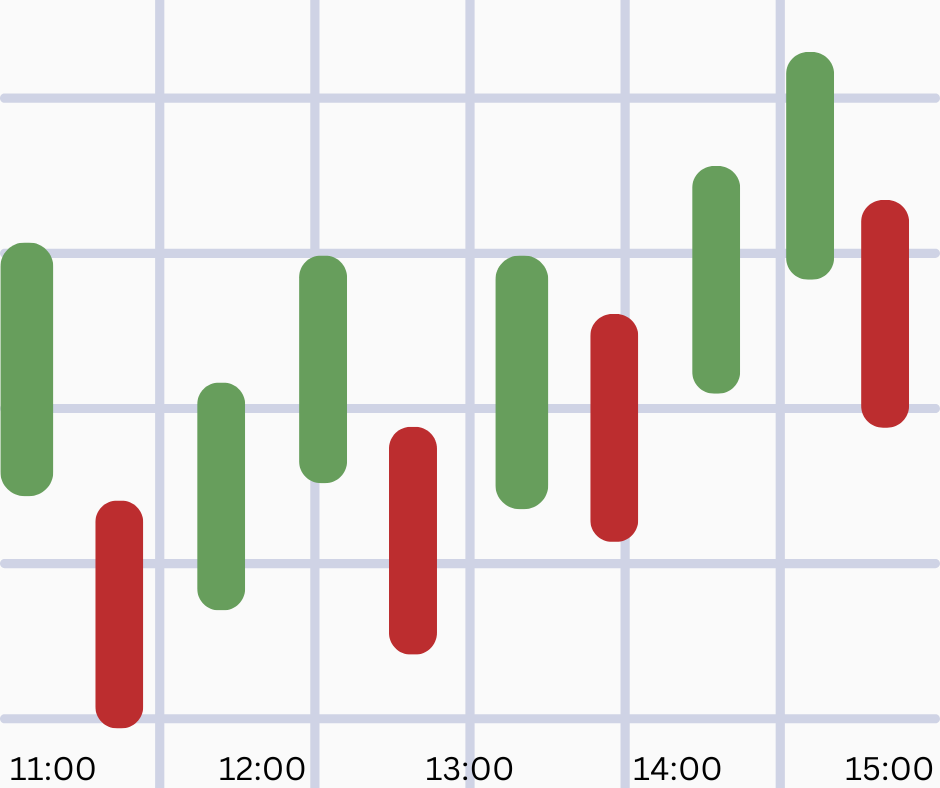
Use a historical, frozen chart. Record the symbol, venue, quote currency, timeframe, time zone and cutoff. Hide later candles. No live order is needed.
Before drawing or calculating anything, write one sentence describing the question you are testing. If the question changes after seeing the result, start a new test rather than rewriting the old one.
1. Draw zones, not perfect lines
On a frozen chart, mark no more than three support/resistance zones using repeated reactions. Record the reason for each zone.
2. Rank evidence
For each zone, note number of reactions, recency, timeframe, volume context and whether price spent time there or only wicked through.
3. Plan a test
Write what would count as hold, break, failed break and retest. These definitions must exist before revealing later candles.
4. Define invalidation
A zone is not immortal. State what close, time spent beyond the area, or structural change would make you stop treating it as relevant.
5. Post-review
Reveal later candles and note whether the zone worked, failed, shifted, or was too broad to be useful.
Practice record
Keep a small table:
| Field | Your note |
|---|---|
| Chart / cutoff | |
| Primary observation | |
| Alternative explanation | |
| Confirmation condition | |
| Invalidation condition | |
| Main execution/data limitation | |
| Outcome after reveal | |
| Process mistake, if any |
Common failure rule
Do not move a line, setting, threshold, timeframe or definition simply because later candles make the original choice look bad. A changed rule is a new test. Preserve the old result.
How this connects to market mastery
Technical mastery is not collecting indicators. It is building a repeatable chain from observation → hypothesis → confirmation → invalidation → review while keeping execution, data quality and market regime separate from the visual story.
Quick check — no money needed

Can you show the original chart cutoff, state the rule you used, name one alternative explanation, identify the exact invalidation condition and explain one mistake that would make the result unreliable? If yes, the practice lesson has done its job.


