
Why you should know this
Volatility affects stop distance, position size and execution; confusing movement with direction can make risk controls fail.
We are not looking for a magic signal. We are learning to read the chart together, define what would prove the idea wrong and keep the later decision reviewable.
The short answer
This lesson shows how volatility tools support sizing, stops and regime analysis.
What ATR can help with
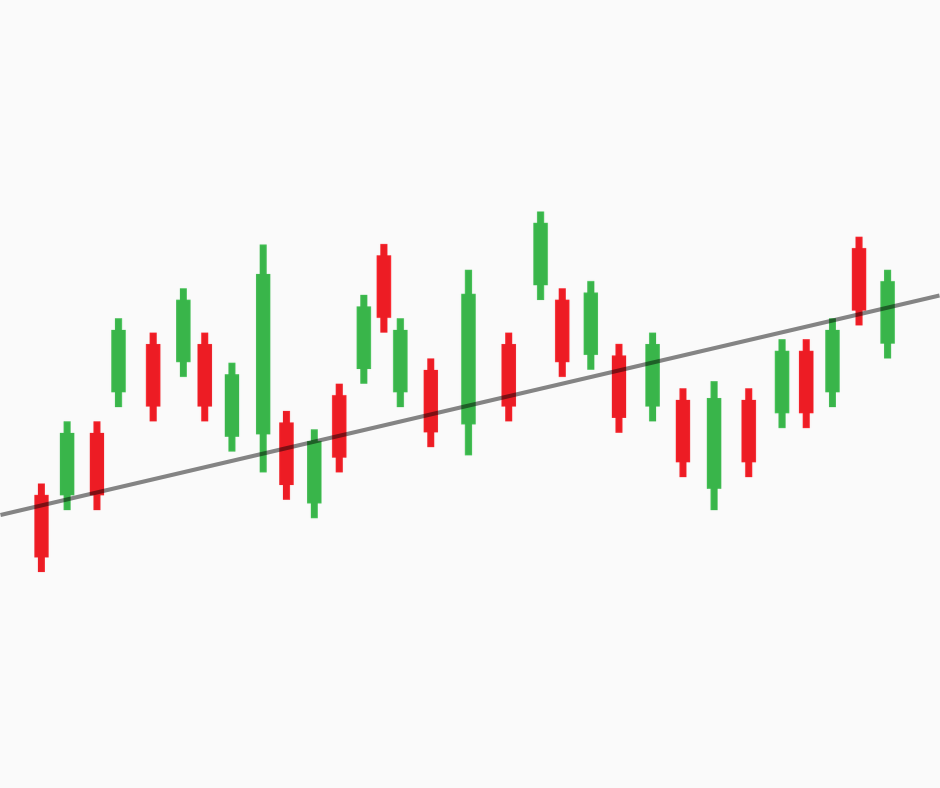
ATR can provide context for:
- whether a candle is unusually large;
- stop or invalidation buffers;
- position-size calculations;
- expected slippage and liquidity stress;
- regime classification.
An ATR-based stop is not automatically safe. A security event can exceed historical ranges, and a stop can fill worse than its trigger.
Bollinger Bands
Bollinger Bands place upper and lower bands around a moving average using a multiple of recent standard deviation. Common defaults exist, but settings are choices.
The creator’s official material emphasizes that the bands define prices as relatively high or low, not automatic sell and buy points. Price can “walk” the upper band in a strong trend.
Band width and the “squeeze”

When recent dispersion contracts, bands narrow; when it expands, they widen. Analysts may call unusually narrow bands a squeeze and expect future expansion.
Low volatility can precede high volatility, but timing and direction are unknown. Define “unusually narrow” using a percentile or other fixed rule. Looking back and selecting the tightest point before a breakout is hindsight.
ATR versus Bollinger Bands
| Tool | Main input | Output | Useful question |
|---|---|---|---|
| ATR | High, low, previous close | Smoothed range in price units | How much has price moved? |
| NATR | ATR and price | Percentage scale | How does movement compare across assets? |
| Bollinger Bands | Moving average and standard deviation | Relative envelope | How dispersed is price around its recent average? |
| Bandwidth | Upper/lower/middle bands | Normalized width | Is dispersion relatively compressed or expanded? |
They measure related but not identical features.
A familiar Philippine or Asian example
A learner opens a historical BTC/USDT or BTC/PHP chart and records the venue, symbol, timeframe, time zone and candle-completion state. They mark one observation, one confirmation condition, one invalidation point and one alternative explanation. No live order is placed.
One risk or limitation
Technical tools summarize historical price, volume or derived data. They can lag, overfit and fail during regime changes, illiquidity, outages or news shocks. A chart pattern or indicator never guarantees direction, execution or profit.
How this connects to market mastery
Market mastery uses chart evidence conditionally. A useful technical plan states the context, confirmation, invalidation, cost and failure condition before any outcome is known.
Quick check — no money needed

Choose a historical chart with its symbol, venue and timeframe visible. Mark the setup’s context, observation, confirmation, invalidation and one common mistake. Explain what evidence would show that the tool is unreliable in this example.
If you can explain your answer and name the invalidation or main limitation, this lesson is complete.


