
Why you should know this
Patterns compress structure into memorable shapes, but flexible drawing can turn hindsight into false evidence.
We are not looking for a magic signal. We are learning to read the chart together, define what would prove the idea wrong and keep the later decision reviewable.
The short answer
This lesson teaches pattern logic, confirmation and failure rather than picture matching.
Triangles

A triangle is a contracting structure bounded by converging zones or lines.
- Symmetrical: lower highs and higher lows.
- Ascending: roughly repeated highs with higher lows.
- Descending: roughly repeated lows with lower highs.
Real charts are imperfect. Define minimum pivot count, maximum boundary tolerance and completion rule. A move beyond the line can fail immediately.
Flags and pennants

A flag is a short consolidation after a strong directional move, often bounded by roughly parallel lines. A pennant is a small contracting structure. The preceding move is called the pole.
Calling any rectangle a flag erases the definition. Specify:
- size and speed of the preceding move;
- maximum consolidation duration;
- retracement limit;
- breakout and invalidation rule.
Traditional theory treats them as continuation patterns, but continuation is not guaranteed.
Head and shoulders
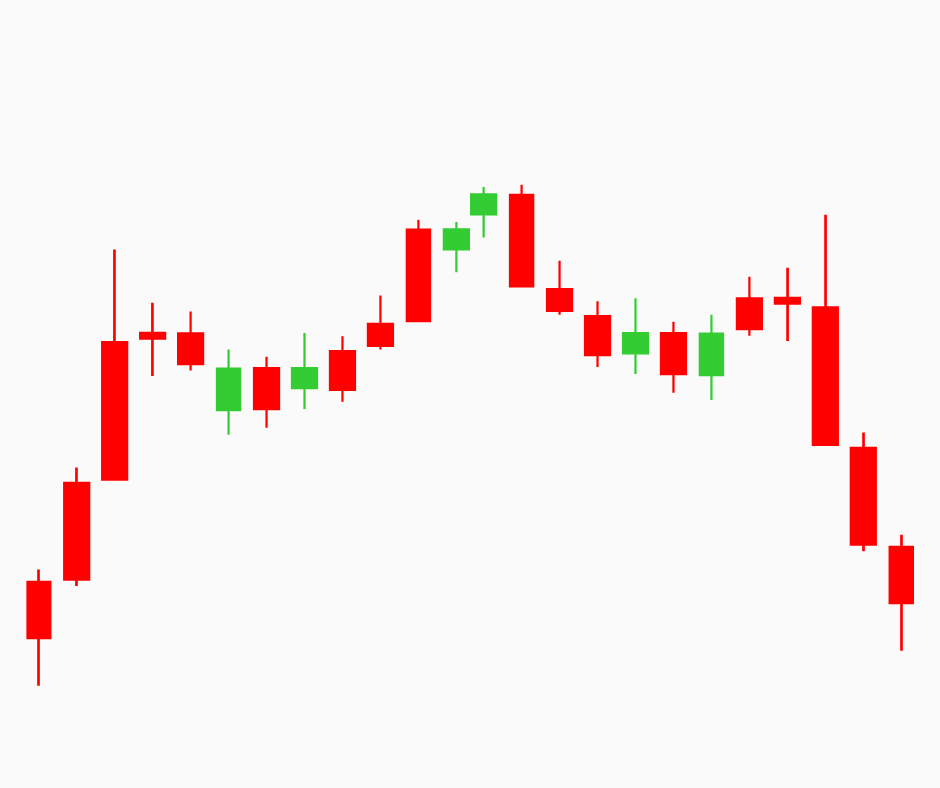
A head-and-shoulders top commonly consists of:
- left shoulder high;
- higher head;
- right shoulder that fails to exceed the head;
- neckline connecting intervening lows.
An inverse formation flips the geometry. Many analysts consider the pattern incomplete until the neckline breaks under a stated rule. Before completion, it may simply be a range or complex pullback.
Symmetry is approximate. Excessive flexibility can make almost any chart fit.
Define a pattern card
| Field | Example question |
|---|---|
| Pair/timeframe | What exact chart owns the pattern? |
| Pivots | Which confirmed points define it? |
| Tolerance | How much boundary deviation is allowed? |
| Completion | Wick, close, buffer or retest? |
| Invalidation | Which movement destroys the geometry? |
| Target | Is it a measured convention or structure-based scenario? |
| Alternative | Range, trend pullback or random consolidation? |
Save the card before completion.
A familiar Philippine or Asian example
A learner opens a historical BTC/USDT or BTC/PHP chart and records the venue, symbol, timeframe, time zone and candle-completion state. They mark one observation, one confirmation condition, one invalidation point and one alternative explanation. No live order is placed.
One risk or limitation
Technical tools summarize historical price, volume or derived data. They can lag, overfit and fail during regime changes, illiquidity, outages or news shocks. A chart pattern or indicator never guarantees direction, execution or profit.
How this connects to market mastery
Market mastery uses chart evidence conditionally. A useful technical plan states the context, confirmation, invalidation, cost and failure condition before any outcome is known.
Quick check — no money needed

Choose a historical chart with its symbol, venue and timeframe visible. Mark the setup’s context, observation, confirmation, invalidation and one common mistake. Explain what evidence would show that the tool is unreliable in this example.
If you can explain your answer and name the invalidation or main limitation, this lesson is complete.


