
Why you should know this
Support and resistance appear in almost every technical conversation. They can help organize market memory and possible decision points—but only if we define them before the next move.
At beginner and advanced levels alike, a zone must answer: which pair, timeframe, evidence and invalidation? Without those basics, “support” often means “the price where I hope the loss stops.”
What support and resistance mean
Support is an area where declines previously slowed, reversed or attracted sufficient demand to change the observed path. Resistance is an area where advances previously slowed or reversed.
These are descriptions of past behavior. Orders can be cancelled, participants can change and new information can overwhelm the area. A zone is not a floor or ceiling guaranteed to hold.
Why zones, not perfect lines
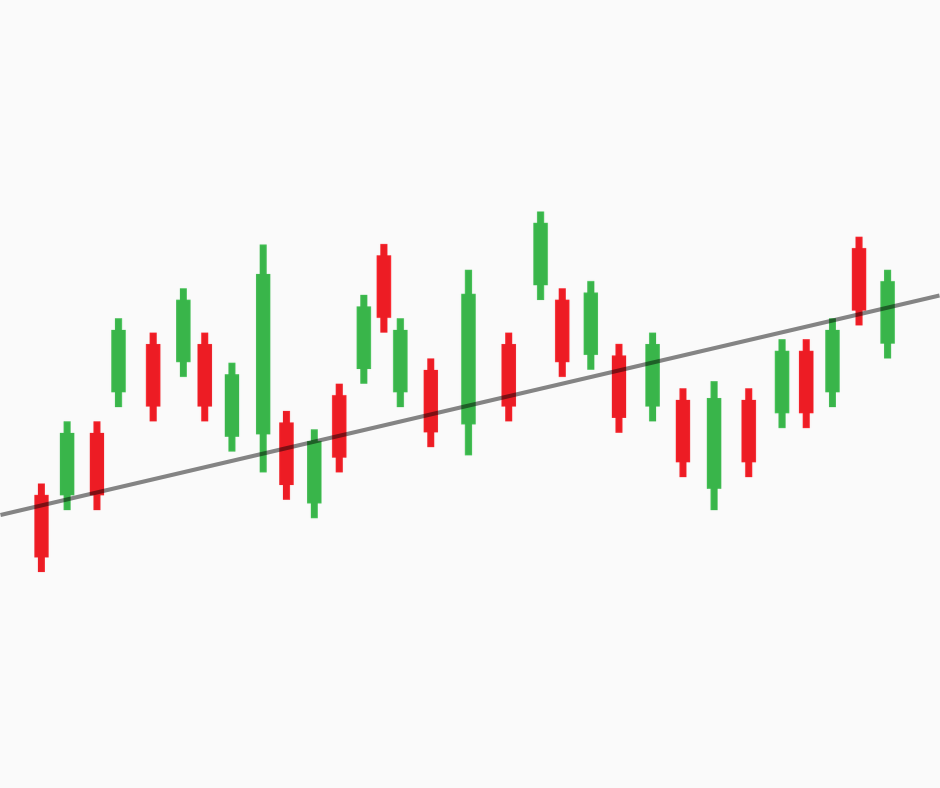
Crypto trades across fragmented venues with different liquidity. Wicks can vary, and participants rarely share one exact entry price. A shaded zone better represents uncertainty.
Define its width using a rule, such as:
- cluster of repeated closes and wicks;
- a percentage band around a pivot;
- a fraction of recent volatility;
- a volume concentration, if the data are reliable.
Choose before seeing the result. Wider zones capture more noise; narrower zones create more apparent “breaks.”
A top-down marking process

- Select the pair, venue and decision timeframe.
- Move one timeframe higher for major structure.
- Mark obvious swing areas with repeated reactions.
- Return to the decision chart and refine—not multiply—the zones.
- Note freshness, number of tests and volume/liquidity context.
- Write what counts as a hold, break or acceptance.
Limit the chart to levels that could materially affect the plan. If every price is important, none is.
Evidence that can strengthen a zone
- multiple meaningful reactions separated in time;
- a prior major swing;
- former range boundary;
- high participation under a defined volume measure;
- alignment across relevant timeframes;
- clean rejection followed by measurable movement.
More touches do not always make a zone stronger. Repeated testing can also consume resting liquidity. The chart alone cannot reveal the remaining order quantity.
Role reversal
Former resistance can behave as support after a breakout; former support can become resistance after a breakdown. This is called role reversal.
Treat it as a hypothesis. Define the retest window and evidence of acceptance. A brief wick below former resistance may be normal volatility under one rule and failure under another.
Horizontal, dynamic and psychological areas
Horizontal zones come from price structure. Moving averages are sometimes called dynamic support or resistance, but they are calculated summaries that move with price. Round numbers may attract attention, yet attention does not ensure defense.
Keep categories separate. If several methods cluster near an area, that is confluence—but correlated tools based on the same price data are not fully independent evidence.
Pair and local-currency differences
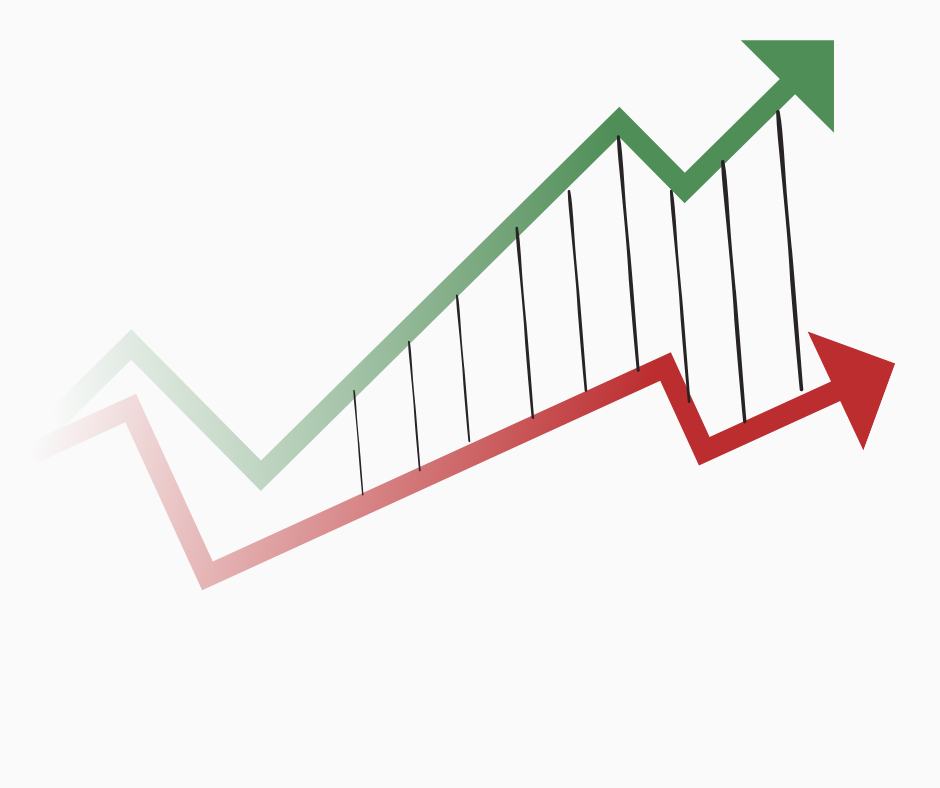
A BTC/USD level translated into PHP moves when USD/PHP moves. Local liquidity can also create different wicks. A Filipino trader should map the actual execution pair or translate the benchmark explicitly.
For practical conversion, a zone may help identify unusual volatility, but a deadline and final usable PHP can matter more than chart perfection.
A zone scorecard
| Criterion | Question |
|---|---|
| Timeframe | Does it belong to the decision horizon? |
| Reactions | Were there repeated, meaningful responses? |
| Freshness | Has the market recently interacted with it? |
| Width | Is the zone rule consistent with volatility? |
| Participation | Do volume/liquidity observations support importance? |
| Invalidation | What observation makes the zone thesis wrong? |
The scorecard organizes judgment; it does not convert judgment into certainty.
Common mistakes
- Drawing levels after price reacts.
- Using exact lines in a noisy market.
- Keeping dozens of overlapping zones.
- Assuming repeated tests always strengthen support.
- Copying a USD level directly into PHP.
- Calling a moving average independent confirmation of price.
- Moving a broken zone to avoid invalidation.
A no-money zone lab
Freeze a historical chart. Mark no more than three zones using a written width rule. For each, record timeframe, supporting reactions, alternative interpretation and invalidation.
Reveal the next 20 candles. Score whether the rule was applied consistently—not whether every zone held. Keep failed zones in the record.
How this connects to market mastery
Zones organize market structure, breakouts, entries, exits and liquidity analysis. Mastery does not mean finding an unbreakable level; it means expressing where an assumption changes and how much uncertainty surrounds that boundary. The shaded zone is a visual reminder that our knowledge has width.
Key takeaways
- Support and resistance describe past response, not guaranteed defense.
- Use zones with a consistent width rule.
- Start higher timeframe, then refine.
- Role reversal and confluence are hypotheses.
- Every zone needs invalidation.
Completion check: Mark and defend three frozen-history zones, then review them without redrawing.


