
Why you should know this
Candles feed almost every technical tool that follows: support and resistance, market structure, moving averages, RSI, volatility bands and backtests. A small misunderstanding about the candle’s time or data source can become a very sophisticated-looking mistake later.
We all started with a chart that looked like a row of mysterious red and green boxes. Let’s learn it together, one candle at a time.
The four prices inside a candle
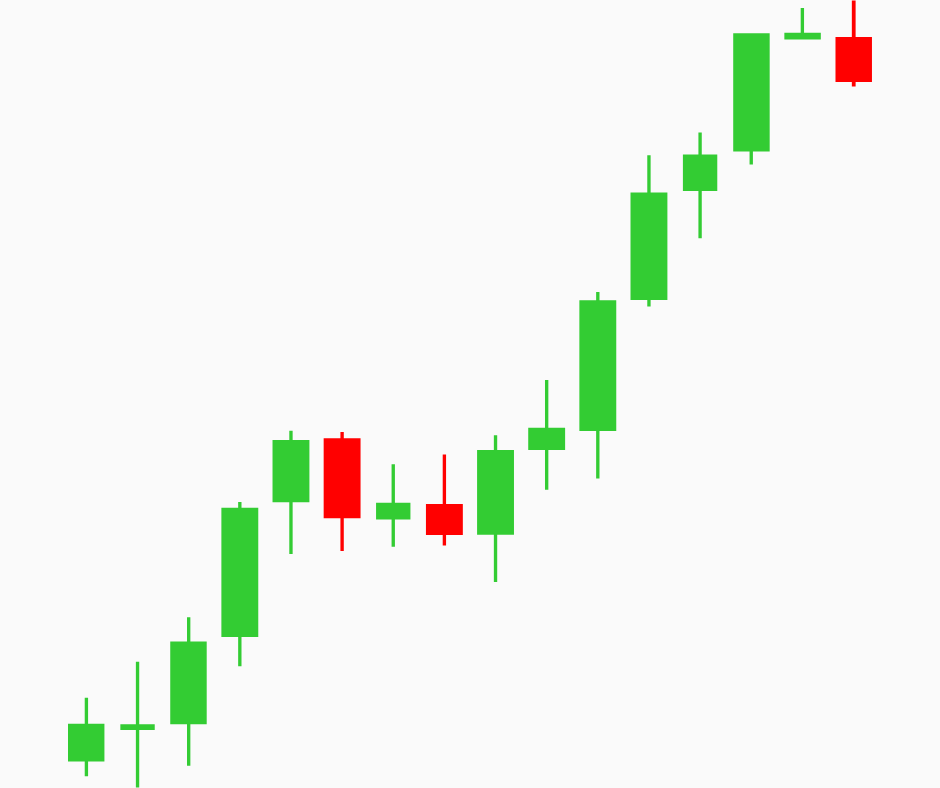
For a selected interval, a candle records:
- Open: first recorded price in the interval.
- High: highest recorded price.
- Low: lowest recorded price.
- Close: last recorded price.
The thick body connects open and close. The thin upper and lower wicks reach the high and low. Chart colors are settings, not laws. Commonly, green means close above open and red means close below open, but always check the legend.
A fictional candle
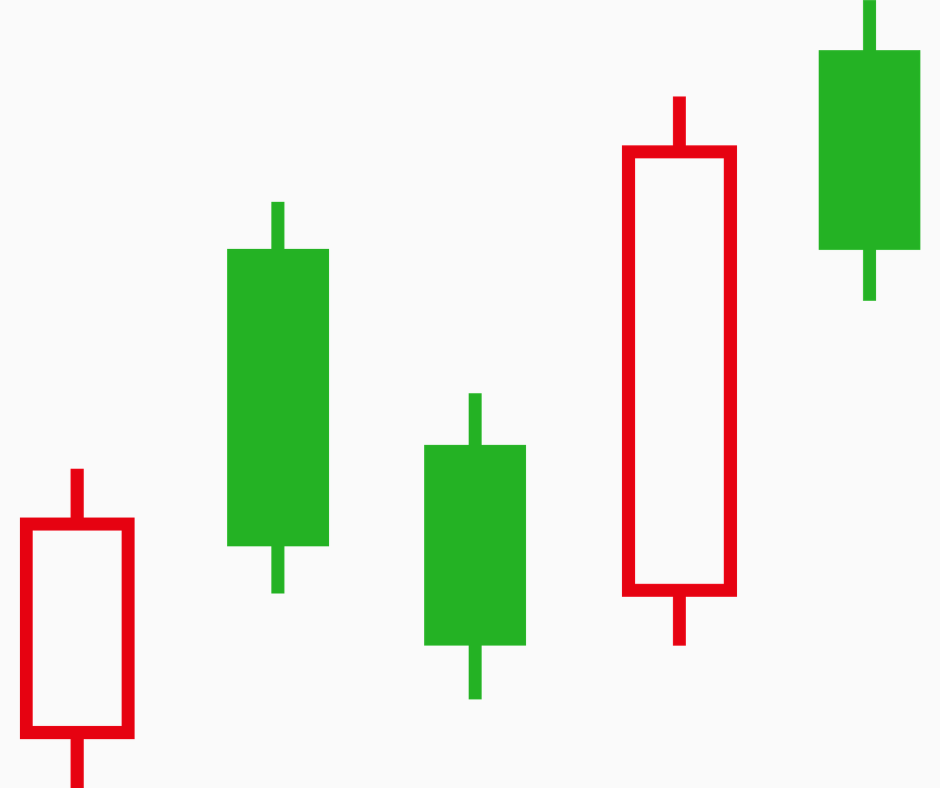
Suppose a one-hour candle has:
- open ₱100;
- high ₱108;
- low ₱97;
- close ₱105.
The body runs from ₱100 to ₱105. The upper wick runs from ₱105 to ₱108; the lower wick from ₱100 to ₱97. The range is ₱11 and the body is ₱5.
This tells us the path reached both ₱97 and ₱108 before finishing above the open. It does not reveal the exact sequence of every trade. High could have occurred before or after low. A candle compresses information.
What body and wicks can suggest
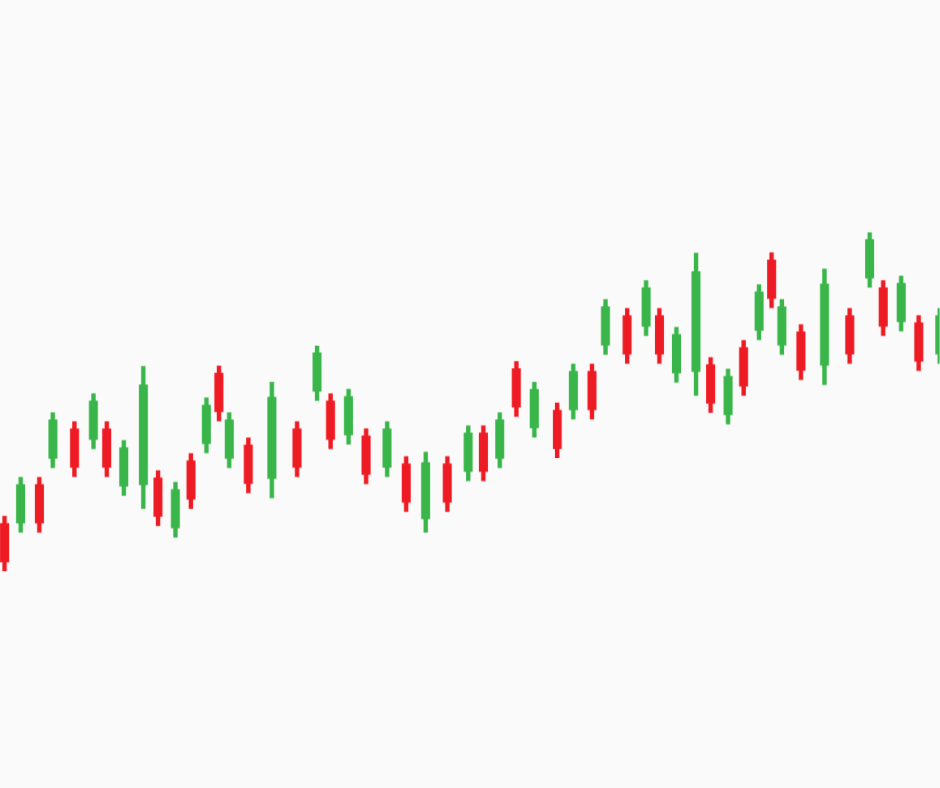
A large body says open and close were far apart relative to the interval. A small body says they were close. A long wick shows price visited an area and moved away before the close.
Analysts sometimes describe this as rejection or pressure. That is an interpretation, not the identity or motive of every trader. A long lower wick can appear before a rally, before a decline or inside random noise. Location and follow-through matter.
One candle versus context
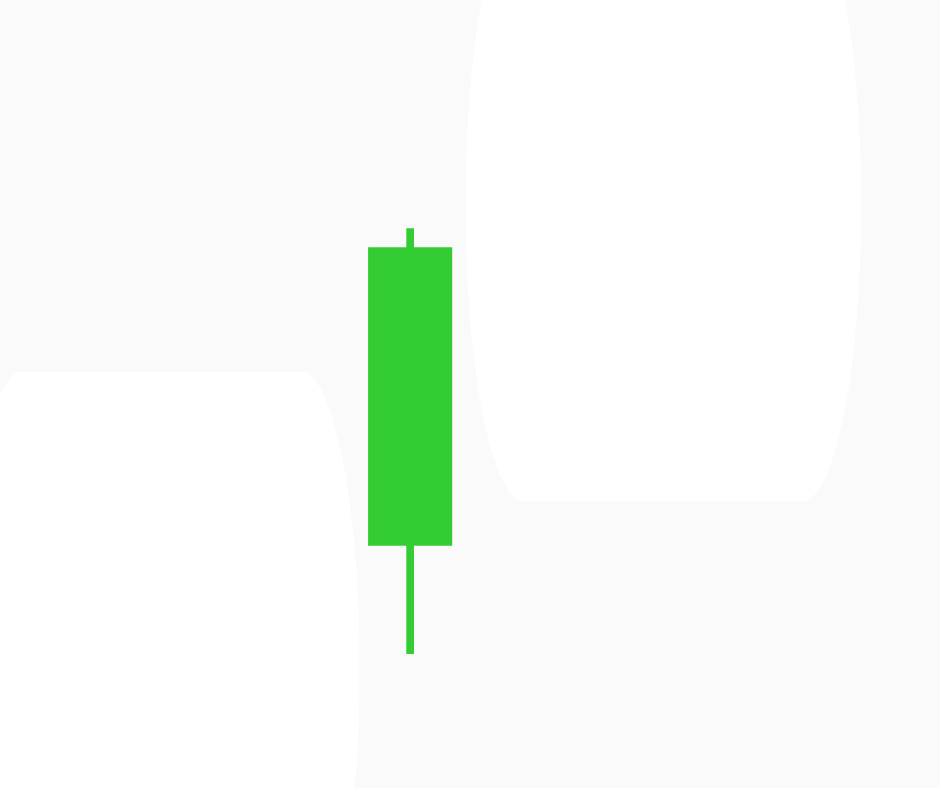
Ask four questions:
- Where is the candle relative to prior structure?
- Is its range unusual versus recent candles?
- Did volume or liquidity change?
- What did the next candles confirm or invalidate?
A small-body candle after a long rally may mean hesitation; the same shape in a quiet range may be ordinary. Names such as doji, hammer or engulfing pattern are labels for geometry. They are not automatic orders.
Timeframe and the 24/7 boundary
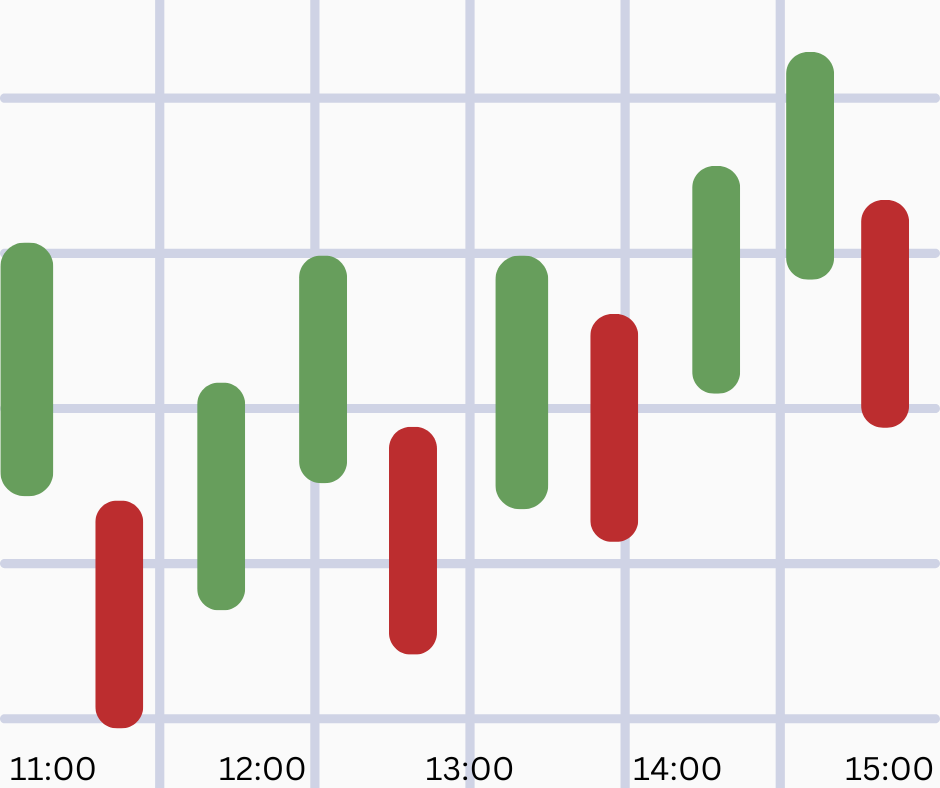
On a one-hour chart, each candle covers an hour; on a daily chart, a day. Because crypto trades continuously, the “daily open” depends on the provider’s time-zone boundary and price source. Two valid providers can show different wicks.
Always record:
- pair and venue or index;
- timeframe;
- time zone;
- whether the current candle is complete.
An unfinished candle can change dramatically before its close.
Pair and currency matter
BTC/USD, BTC/USDT and BTC/PHP are related but not identical. FX, stablecoin basis and local liquidity can create different candle shapes. A Filipino reader should not copy a level from a USD chart into a PHP order without translation and execution review.
Heikin-Ashi and other transformed candles
Some chart types transform prices to smooth trends. Heikin-Ashi open and close values, for example, are calculated values rather than the market’s raw OHLC for that interval. These charts can aid visualization but should not be mistaken for directly executable prices.
Check the chart type before reading or backtesting.
A candle reading script

Use this sentence:
On the [timeframe] [pair] chart from [source/time zone], the completed candle opened at X, traded between Y and Z, and closed at W. Its body/range was [ordinary/unusual under a stated baseline]. At [location], one interpretation is __. This would need confirmation from __ and would be weakened by ____.
The script keeps fact, interpretation and invalidation together.
Common mistakes
- Reading color without checking settings.
- Treating the wick as the exact transaction sequence.
- Acting on an unfinished candle.
- Using one-candle names as guaranteed signals.
- Ignoring pair, venue and time-zone differences.
- Backtesting transformed candles as raw executable prices.
- Calling every long wick manipulation.
A no-money candle lab
Create three fictional OHLC rows. Draw each candle on paper. For each, calculate range and body size, mark the close’s location within the range and write one factual sentence.
Then place the same candle at the top of an uptrend, bottom of a range and middle of congestion. Write how the interpretation changes. Do not choose a trade.
How this connects to market mastery
Mastery begins with respecting what the data actually contain. Candles compress transactions into four prices, so every later pattern and indicator inherits that compression. Advanced analysts still check raw OHLC, provider construction and unfinished bars. The foundation never disappears; it becomes more important.
Key takeaways
- A candle records open, high, low and close for a defined interval.
- Body and wick describe geometry, not certain participant motives.
- Context, volume, liquidity and follow-through matter.
- Daily crypto boundaries and price sources can differ.
- Transformed candles may not show executable raw prices.
Completion check: Draw and describe three fictional candles, then explain why the same shape can mean different things in different locations.


