
Why you should know this
Technical analysis is a toolbox for organizing observed market data. It is not a complete theory of technology, solvency, regulation, custody or human behavior.
An experienced trader’s advantage is not always a better signal. Often it is recognizing when the signal’s assumptions have broken. Everyone begins by wanting the chart to answer everything; mastery includes letting it say “I don’t know.”
1. The data are wrong or incomplete

Bad ticks, missing candles, wrong time zones, stablecoin depegs, index changes and venue outages can corrupt indicators. If two reputable feeds disagree materially, the signal may be a data-quality problem.
Response: pause, preserve raw data, compare sources and document corrections. Do not trade through uncertainty just because an indicator printed a value.
2. Liquidity disappears

Technical levels assume some ability to transact near observed prices. In a thin or stressed market, spreads widen, books empty and stops slip. A pattern target can be irrelevant if the exit route fails.
Response: prioritize execution and operational risk. Reduce or avoid exposure under the prewritten rule; do not assume displayed quotes will return.
3. An external shock changes the information set

A hack, court decision, listing change, protocol halt or policy announcement can make historical behavior a weak guide. Price may gap through every line.
Response: verify primary sources, reassess fundamentals and wait for the market to form new structure. Technicals can describe the reaction later; they cannot make the old thesis valid.
4. The regime changes
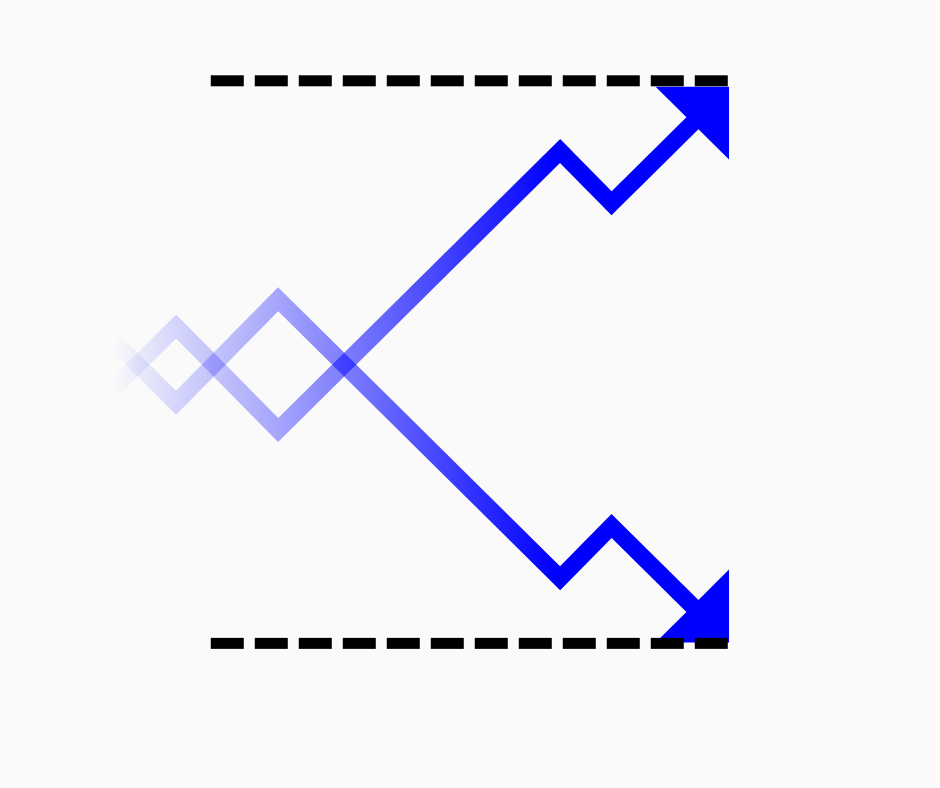
A trend model can whipsaw in a range; a mean-reversion model can fail in a sustained breakout. Correlation and volatility can shift.
Response: use predefined regime and transition rules. Do not change the label solely to protect the current position.
5. The strategy was overfit

If a rule depended on one asset, a precise parameter and a favorable backtest window, live failure may reveal selection bias rather than bad luck.
Response: review all experiments, untouched data, cost assumptions and parameter sensitivity. A failed model deserves investigation, not immediate optimization on the same sample.
6. Too many participants adapt

If many participants exploit a simple pattern, orders can arrive earlier, costs can rise or the relationship can weaken. Alternatively, widespread attention can temporarily reinforce a level. Markets adapt in more than one direction.
Response: monitor out-of-sample effect size, turnover and execution, not just signal frequency.
7. The question is fundamental

Charts cannot tell us with certainty:
- whether reserves fully back a stablecoin;
- whether a smart contract has a critical vulnerability;
- whether token holders receive economic value;
- whether a legal permission applies;
- whether a team is truthful;
- who controls governance in practice.
Price may reflect market beliefs about these issues, including wrong beliefs. Use primary documents, code, audits, on-chain data and legal analysis.
8. The objective is practical, not speculative

A remittance recipient needing pesos for rent has a deadline, not a technical thesis. Waiting for RSI to improve can expose essential money to unnecessary price risk.
Response: optimize for final usable amount, safety, compliance and timing. Technical analysis may help identify execution conditions, but it should not hijack the task.
A failure-mode matrix
| Failure | Warning | First response |
|---|---|---|
| Data | Feed disagreement or revision | Stop and reconcile |
| Liquidity | Spread/depth deterioration | Protect execution and size |
| Shock | New primary-source event | Rebuild information set |
| Regime | Rule’s assumptions no longer present | Apply transition rule |
| Model | Out-of-sample decay | Audit overfitting and costs |
| Scope | Question concerns utility/security/law | Switch evidence discipline |
| Objective | Real-world deadline dominates | Prioritize practical outcome |
Stop conditions for the analytical process

Before use, define conditions that suspend the method:
- data gap above tolerance;
- spread or slippage beyond limit;
- unverified material incident;
- stablecoin/reference failure;
- venue restriction or operational outage;
- statistically or practically significant model decay;
- personal fatigue or inability to supervise risk.
Suspension is not defeat. It is a safety feature.
Common mistakes
- Adding more indicators when data are wrong.
- Widening stops when liquidity disappears.
- Treating every loss as regime change.
- re-optimizing immediately after failure.
- Using price to prove reserves, security or legality.
- forcing a remittance into a speculative timing plan.
- believing 20 years of experience removes model risk.
A no-money diagnosis lab
Classify five fictional cases: bad candle feed, sudden exploit, slow range, stablecoin basis break and thin PHP route. For each, write:
- what technical data still describe;
- what they cannot answer;
- the stop condition;
- the next evidence source;
- what would allow analysis to resume.
How this connects to market mastery
The final technical skill is knowing its boundary. That boundary leads naturally to fundamental and on-chain analysis: utility, tokenomics, teams, activity, security, regulation and value accrual. Market mastery is plural. No single lens owns the whole truth.
Key takeaways
- Technical analysis depends on data, liquidity, regime and execution assumptions.
- Shocks can invalidate the old information set.
- Overfitting can look like a strategy that suddenly “stopped working.”
- Charts cannot establish utility, reserves, security or legality.
- Suspending a method is a professional control.
Completion check: Diagnose five failures and identify the non-technical evidence needed before proceeding.


