
Why you should know this
Indicators are calculations, not personalities. They do not betray us; we ask them the wrong question, use weak data or interpret a historical summary as foresight.
Everyone makes these mistakes while learning. The useful response is not embarrassment. It is a repeatable checklist that makes the next analysis kinder, clearer and more resilient.
1. Treating a reactive tool as a forecast
Moving averages, RSI and ATR use historical data. They can organize current conditions but cannot know the next announcement.
Correction: Describe the calculation first, then the conditional interpretation and invalidation.
2. Using default settings without a purpose
A 14-period RSI or 20-period band is a convention. Period means different real time on different charts.
Correction: State why the setting matches the horizon and test nearby settings without winner-picking.
3. Confusing “overbought” with “must fall”

Momentum can remain elevated in a strong trend.
Correction: read the oscillator with structure and regime; define reversal evidence separately.
4. Counting correlated indicators as independent votes
RSI, stochastic and MACD all transform related price history. Three aligned panels may be one underlying move.
Correction: identify the unique information each input contributes—price, volume, liquidity, volatility or external evidence.
5. Mixing timeframes and pairs

A daily BTC/USD average and hourly BTC/PHP RSI do not automatically form one thesis.
Correction: assign context, decision and execution roles; document currency and provider.
6. Acting on an unfinished or repainting value
Current-candle indicators change until the candle completes. Pivot and transformed tools may use future bars or revise past visual output.
Correction: learn the calculation, wait for the stated confirmation and backtest with the same information timing.
7. Ignoring data construction
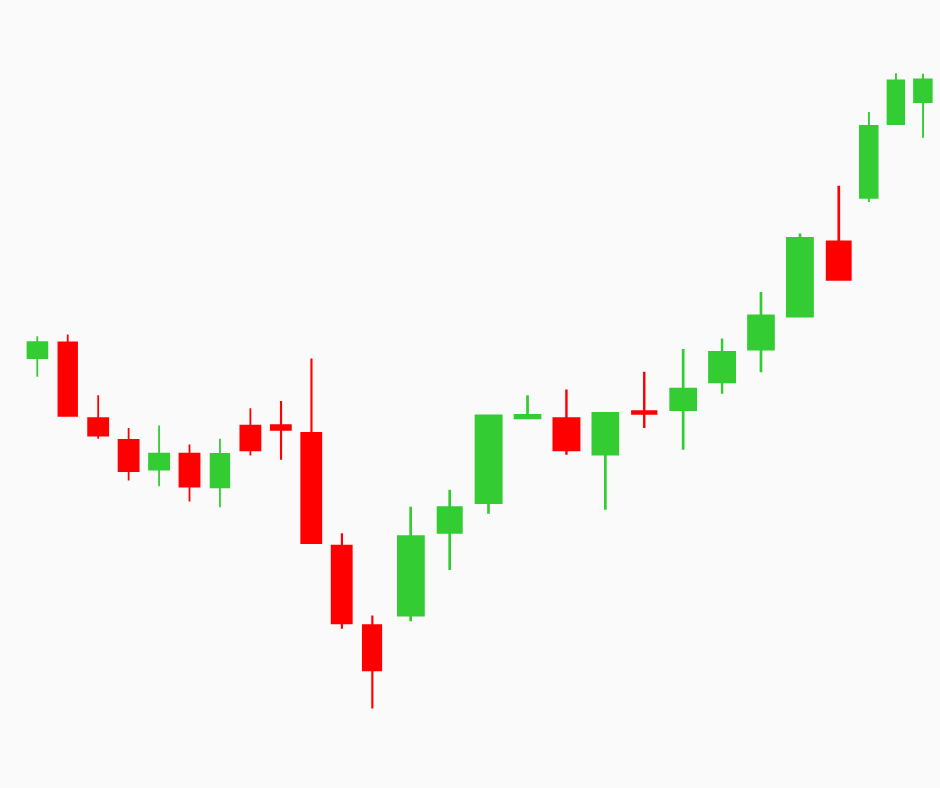
Venue outages, stablecoin basis, candle cutoffs, bad ticks and volume aggregation can change signals.
Correction: record source, time zone, missing-data treatment and quality checks.
8. Optimizing until history looks perfect
Trying many periods, thresholds and assets makes a lucky combination likely.
Correction: maintain an experiment register, reserve untouched data and report all variants.
9. Forgetting execution and costs

A signal at candle close may not fill at that close. Spread, slippage, fees, funding and latency can erase a small edge.
Correction: shift execution to a knowable time and model conservative costs.
10. Letting the indicator replace risk management
No indicator limits loss by itself. A perfect-looking signal can meet a security incident, gap or platform failure.
Correction: define affordable loss, position size, invalidation, order behavior and no-trade conditions before entry.
An indicator audit card
| Question | Pass evidence |
|---|---|
| Input | Pair, provider, price field and timeframe named |
| Formula | Period, smoothing and initialization known |
| Timing | Completed/repainting behavior understood |
| Context | Regime and structure recorded |
| Independence | Correlated inputs identified |
| Data | Gaps, cutoffs and quality reviewed |
| Test | All experiments and untouched sample preserved |
| Execution | Costs, lag and fill assumptions modeled |
| Risk | Invalidation, size and no-trade rules fixed |
| Language | No certainty or personalized instruction |
If the formula is unknown, pause before interpreting it. Curiosity is a professional control.
Philippine and Asian context
Provider defaults may emphasize USD or US hours. A Filipino reader should check PHP translation, local liquidity and Manila-time events. Do not import a strategy from another market without rechecking currency, venue and end-to-end costs.
A no-money audit lab
Build a deliberately flawed template: five indicators, mixed timeframes, current candle, no provider, no costs and a “guaranteed” label. Use the audit card to correct it.
Then remove every indicator that does not add a distinct decision. The cleaner chart may be the stronger result.
How this connects to market mastery
Mastery is not the number of indicators known. It is the ability to audit inputs, timing, assumptions and risk. These ten corrections prepare the reader to recognize when technical analysis itself is losing relevance.
Key takeaways
- Indicators transform data; they do not know the future.
- Defaults and thresholds need purpose and testing.
- Correlated panels can create false confluence.
- Timing, data quality and costs belong in the signal.
- Risk management remains outside the indicator.
Completion check: Audit one fictional indicator setup against all ten controls and remove unsupported complexity.


