
Why you should know this
Breakouts attract urgency precisely when slippage and failure risk can rise; a written plan protects process even when the move fails.
We are not looking for a magic signal. We are learning to read the chart together, define what would prove the idea wrong and keep the later decision reviewable.
The short answer
This lesson connects level, volume, volatility, retest and invalidation.
Define the breakout area
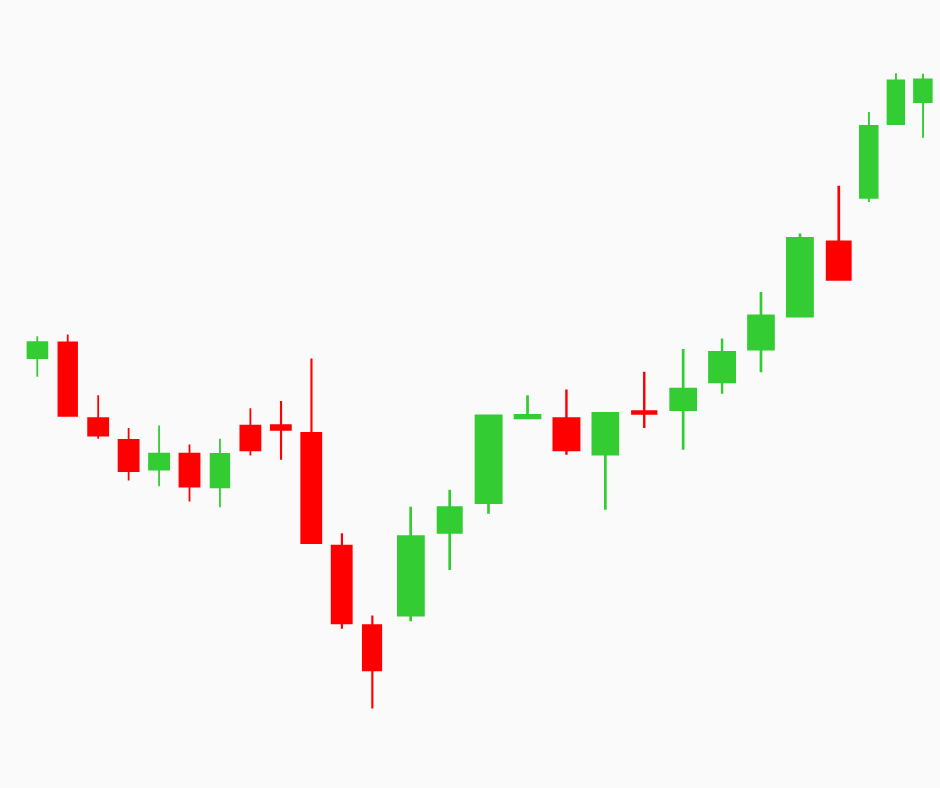
Use a zone supported by prior structure, not a line drawn after the move. Record pair, venue, timeframe, width and why the area matters.
Then define what counts as a break:
- any trade beyond the zone;
- a candle close beyond it;
- a close plus percentage/ATR buffer;
- a second close;
- a break followed by retest.
Stricter confirmation usually enters later and may miss moves. Earlier entry gets better potential price but more false signals.
Confirmation evidence

Possible supporting observations:
- relative volume expansion under a trusted dataset;
- range/volatility expansion;
- healthy spread and available depth;
- broader market or relative-strength agreement;
- absence of immediate rejection;
- catalyst verified from a primary source.
These reduce uncertainty only under a tested framework. Several indicators derived from the same price data are not independent votes.
Liquidity and slippage
At a visible breakout, many orders can trigger together. Thin books may produce fast slippage. A stop-market order prioritizes exit, not price; a stop-limit protects price but may not fill.
Review order type, size and event conditions before the trigger. A correct chart view can still produce poor execution.
Philippine and Asian context

A breakout on a global USD venue may not appear the same on a PHP pair. FX and local depth can change execution. Late-night US events can create sharp movement during Manila hours; no one must participate while tired or unable to monitor risk.
For remittance users, a deadline-based conversion should not become a breakout speculation.
A familiar Philippine or Asian example
A learner opens a historical BTC/USDT or BTC/PHP chart and records the venue, symbol, timeframe, time zone and candle-completion state. They mark one observation, one confirmation condition, one invalidation point and one alternative explanation. No live order is placed.
One risk or limitation
Technical tools summarize historical price, volume or derived data. They can lag, overfit and fail during regime changes, illiquidity, outages or news shocks. A chart pattern or indicator never guarantees direction, execution or profit.
How this connects to market mastery
Market mastery uses chart evidence conditionally. A useful technical plan states the context, confirmation, invalidation, cost and failure condition before any outcome is known.
Quick check — no money needed

Choose a historical chart with its symbol, venue and timeframe visible. Mark the setup’s context, observation, confirmation, invalidation and one common mistake. Explain what evidence would show that the tool is unreliable in this example.
If you can explain your answer and name the invalidation or main limitation, this lesson is complete.


