
Why you should know this
A ₱1,000 stop can be huge for one asset and ordinary noise for another. Volatility gives movement a scale. That scale supports position sizing, execution expectations and scenario design.
It does not say up or down. Volatility can expand in rallies, crashes and chaotic ranges.
True range

True range for a period is the greatest of:
- current high minus current low;
- absolute current high minus previous close;
- absolute current low minus previous close.
The previous close captures gaps between periods. In continuously traded crypto, venue outages, thin trading and weekend transitions can still create discontinuities.
Example: previous close 100, current high 108, current low 103.
- high–low = 5;
- |high–previous close| = 8;
- |low–previous close| = 3.
True range is 8.
Average True Range
ATR smooths true range over N periods. Implementation often uses Wilder-style smoothing, while some platforms may use another method. Verify the tool.
ATR is in price units. An ATR of ₱5 for a ₱100 asset is not comparable with ₱5 for a ₱10,000 asset. Normalize:
NATR ≈ ATR ÷ Price × 100
State whether price is current close, average or another denominator.
What ATR can help with
ATR can provide context for:
- whether a candle is unusually large;
- stop or invalidation buffers;
- position-size calculations;
- expected slippage and liquidity stress;
- regime classification.
An ATR-based stop is not automatically safe. A security event can exceed historical ranges, and a stop can fill worse than its trigger.
Bollinger Bands
Bollinger Bands place upper and lower bands around a moving average using a multiple of recent standard deviation. Common defaults exist, but settings are choices.
The creator’s official material emphasizes that the bands define prices as relatively high or low, not automatic sell and buy points. Price can “walk” the upper band in a strong trend.
Band width and the “squeeze”
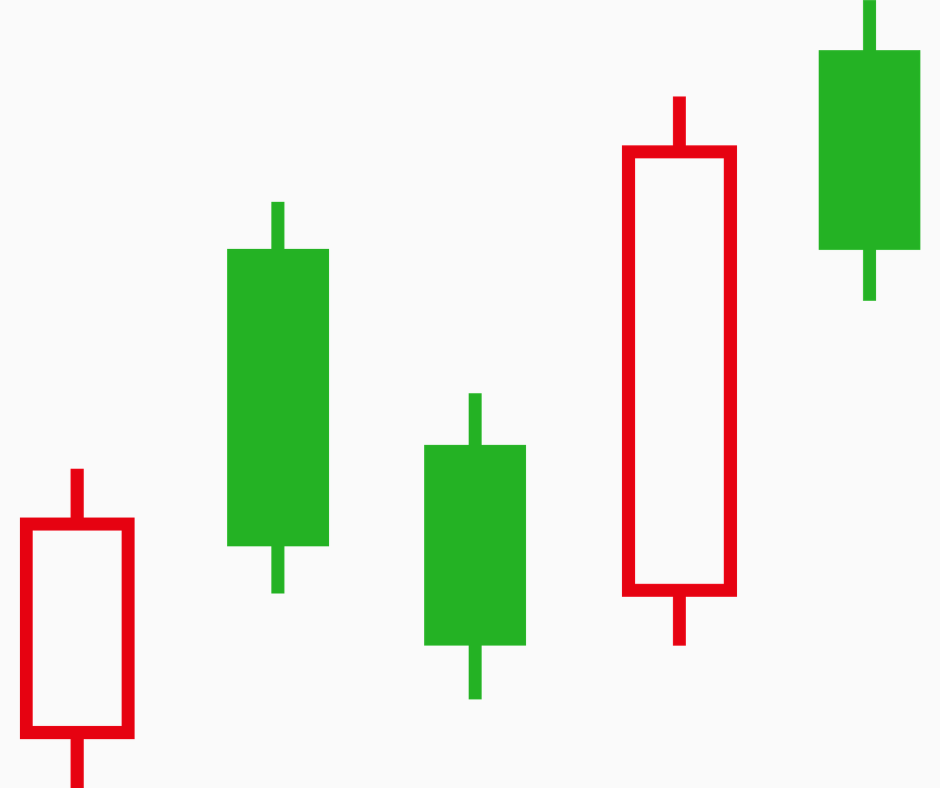
When recent dispersion contracts, bands narrow; when it expands, they widen. Analysts may call unusually narrow bands a squeeze and expect future expansion.
Low volatility can precede high volatility, but timing and direction are unknown. Define “unusually narrow” using a percentile or other fixed rule. Looking back and selecting the tightest point before a breakout is hindsight.
Standard deviation is not probability magic
Price returns are not guaranteed to follow a stable normal distribution. Saying two bands equal a fixed probability range can be misleading, especially with fat tails, trends and changing volatility.
Bands are a rolling empirical tool. They do not create a promise that price must stay inside.
ATR versus Bollinger Bands
| Tool | Main input | Output | Useful question |
|---|---|---|---|
| ATR | High, low, previous close | Smoothed range in price units | How much has price moved? |
| NATR | ATR and price | Percentage scale | How does movement compare across assets? |
| Bollinger Bands | Moving average and standard deviation | Relative envelope | How dispersed is price around its recent average? |
| Bandwidth | Upper/lower/middle bands | Normalized width | Is dispersion relatively compressed or expanded? |
They measure related but not identical features.
Philippine and Asian context

Volatility in BTC/PHP includes crypto and FX movement plus local-market effects. A USD-chart ATR cannot be copied as a peso stop. Thin regional hours or fiat holidays may widen spreads independently of recent candle ranges.
Common mistakes
- Treating ATR as direction.
- Comparing raw ATR across different price scales.
- Assuming a band touch must reverse.
- Calling every narrow band a profitable breakout setup.
- Using normal-distribution probability claims casually.
- Ignoring smoothing and initialization differences.
- Setting stop distance without affordable position sizing.
A no-money volatility lab
Calculate true range for five fictional candles, including one gap. Smooth them with a stated method. Normalize the result by price.
Then create two price series: steady trend and choppy range with similar standard deviation. Plot bands and explain why equal width does not imply equal structure or direction.
How this connects to market mastery
Volatility converts “the chart feels wild” into a measurable observation. It connects technical analysis to execution and survival. Mastery uses volatility to scale decisions while remembering that historical range cannot bound the next shock.
Key takeaways
- True range includes current range and gaps from the prior close.
- ATR measures movement in price units; normalization aids comparison.
- Bollinger Bands define relative location around a rolling average.
- Narrow or wide bands do not determine direction.
- Historical volatility can underestimate shocks.
Completion check: Calculate true range and normalized ATR, then describe band expansion without forecasting up or down.


