
Why you should know this
Moving averages are among the first indicators many traders add—and ingredients inside MACD, volatility bands and systematic strategies. They look simple because the line is smooth. The important complexity is in the period, weighting, price input and timeframe.
Knowing the calculation lets us use the tool as a summary, not an authority.
Simple moving average

An N-period simple moving average is the arithmetic mean of the latest N selected prices:
SMA = Sum of latest N prices ÷ N
For closes of 100, 102, 101, 105 and 107:
Five-period SMA = 515 ÷ 5 = 103
On the next period, the oldest value drops and the newest enters. Each included price has equal weight.
Exponential moving average
An EMA gives more weight to recent observations. A common smoothing factor is:
α = 2 ÷ (N + 1)
Then:
EMA today = α × Price today + (1 − α) × EMA yesterday
The starting value and implementation can cause small provider differences. The EMA normally responds faster than an SMA of the same nominal period, but faster also means more sensitivity to noise.
Period means candles, not days
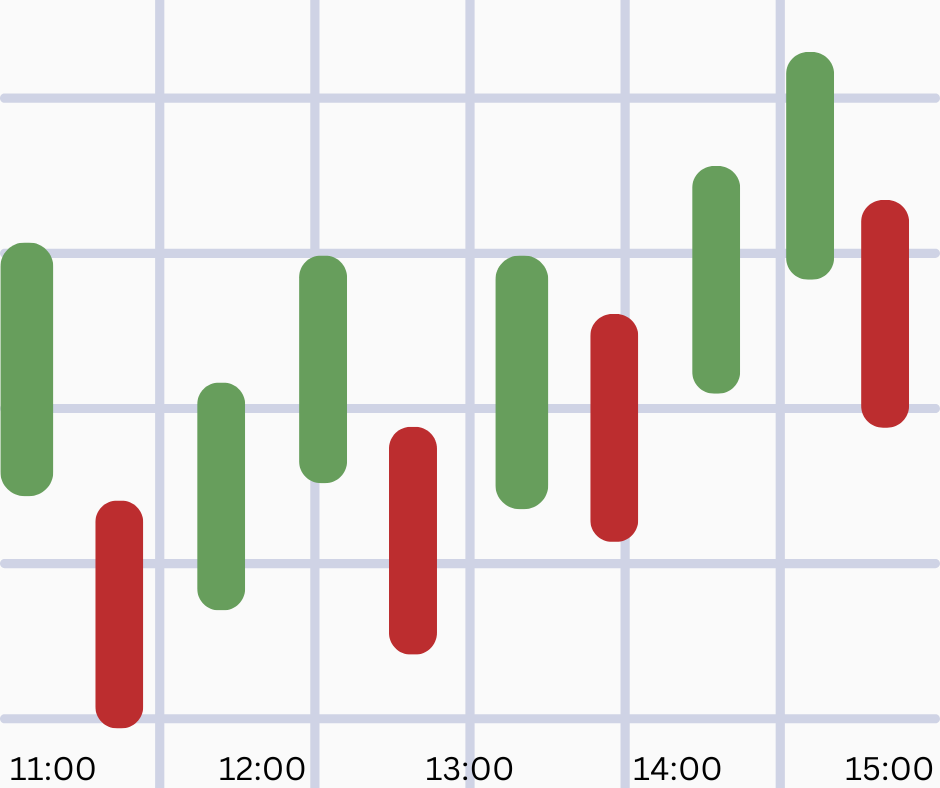
A 20-period average on a one-hour chart summarizes 20 hourly candles. On a daily chart it summarizes 20 daily candles. In continuous crypto markets, the daily boundary remains provider-specific.
Write “20-day SMA on provider X” rather than simply “the 20 MA.”
What a moving average can show
Analysts use moving averages to:
- smooth price variation;
- estimate trend direction through slope;
- compare short and long horizons;
- organize pullback or crossover observations;
- define systematic conditions.
Because the input is historical price, the indicator is reactive. It cannot know an upcoming security incident or policy decision.
Price crossings
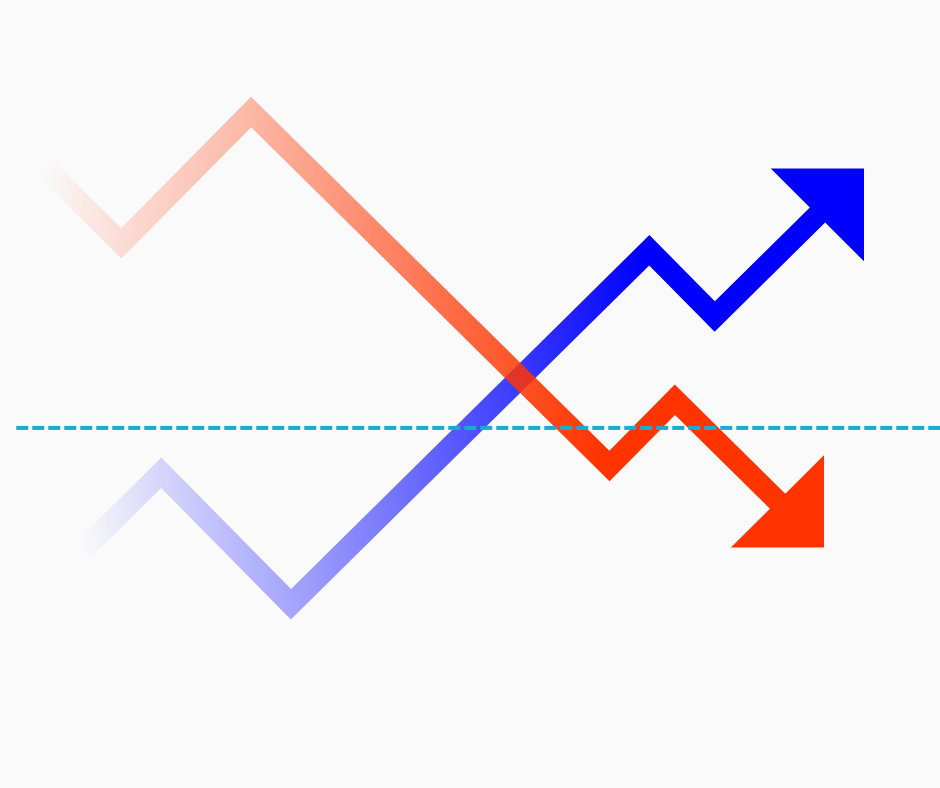
Price above an average can indicate it is above its recent mean. A cross below says it moved below. Neither sentence proves reversal.
In a range, price may cross repeatedly and create whipsaw. In a trend, an average can lag far behind. The same rule changes behavior with the regime.
Average crossings
A “golden cross” or “death cross” compares a shorter and longer average, often with popular settings. Those names carry emotional weight, but the event is simply one calculated series crossing another.
Any performance claim needs:
- exact settings and price input;
- asset universe and period;
- entry/exit timing;
- fees, slippage and funding;
- out-of-sample results;
- record of all tested variants.
Choosing the best pair of averages after trying hundreds is backtest overfitting.
Dynamic support and resistance?
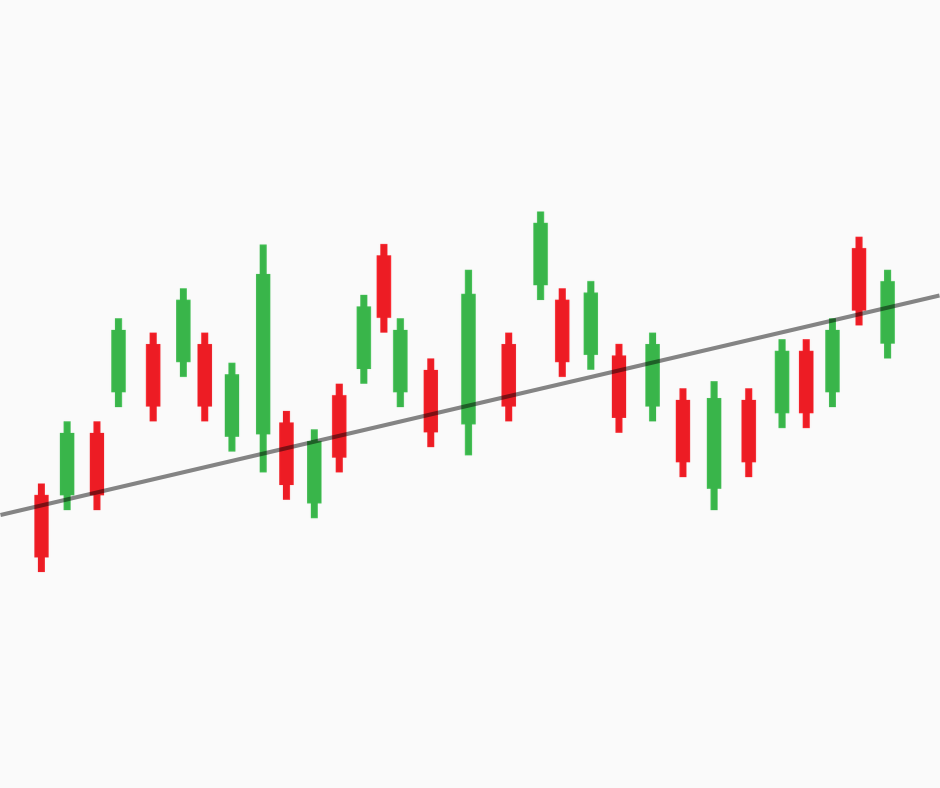
Price sometimes reacts near an average because many participants watch it or because the average summarizes the same trend structure they observe. But the line has no resting orders by definition. Call it a reference, not a guaranteed wall.
SMA versus EMA
| Feature | SMA | EMA |
|---|---|---|
| Weight | Equal within window | More weight to recent prices |
| Reaction | Usually slower | Usually faster |
| Noise | More smoothing | More sensitivity |
| Memory | Drops oldest point at window edge | Weights history progressively |
| Best use | Depends on tested purpose | Depends on tested purpose |
There is no universally superior choice.
Common mistakes
- Forgetting period means candles.
- Assuming smoother means safer.
- Calling the average predictive.
- Using crossover names as instructions.
- Adding many correlated averages as “confirmation.”
- Optimizing settings on one asset and period.
- Ignoring provider, price input, fees and regime.
A no-money moving-average lab
Use ten fictional closes. Calculate a five-period SMA through time. Then create a sudden price jump and observe when the old value leaves the window.
Use a spreadsheet to calculate a five-period EMA with disclosed initialization. Compare:
- reaction speed;
- lag after the shock;
- number of price crossings;
- how the result changes on a ranging series.
Do not judge which is “best.” Match behavior to purpose.
How this connects to market mastery
Moving averages teach a central truth: every indicator is a transformation of inputs and choices. Advanced analysis requires understanding those choices, testing them across regimes and respecting lag. The five-period hand calculation is not childish—it is the foundation for auditing a complex system.
Key takeaways
- SMA weights recent window values equally; EMA emphasizes recent data.
- Period, timeframe, input and initialization matter.
- Moving averages react to price history.
- Crosses can whipsaw and need context.
- Parameter search creates overfitting risk.
Completion check: Calculate SMA and EMA responses to a fictional shock and explain their lag without calling either predictive.


