
Why you should know this
Candles are the raw visual language used by later lessons; misreading their time, pair or price source corrupts every indicator built on them.
We are not looking for a magic signal. We are learning to read the chart together, define what would prove the idea wrong and keep the later decision reviewable.
The short answer
This lesson explains open, high, low, close and candle context.
The four prices inside a candle
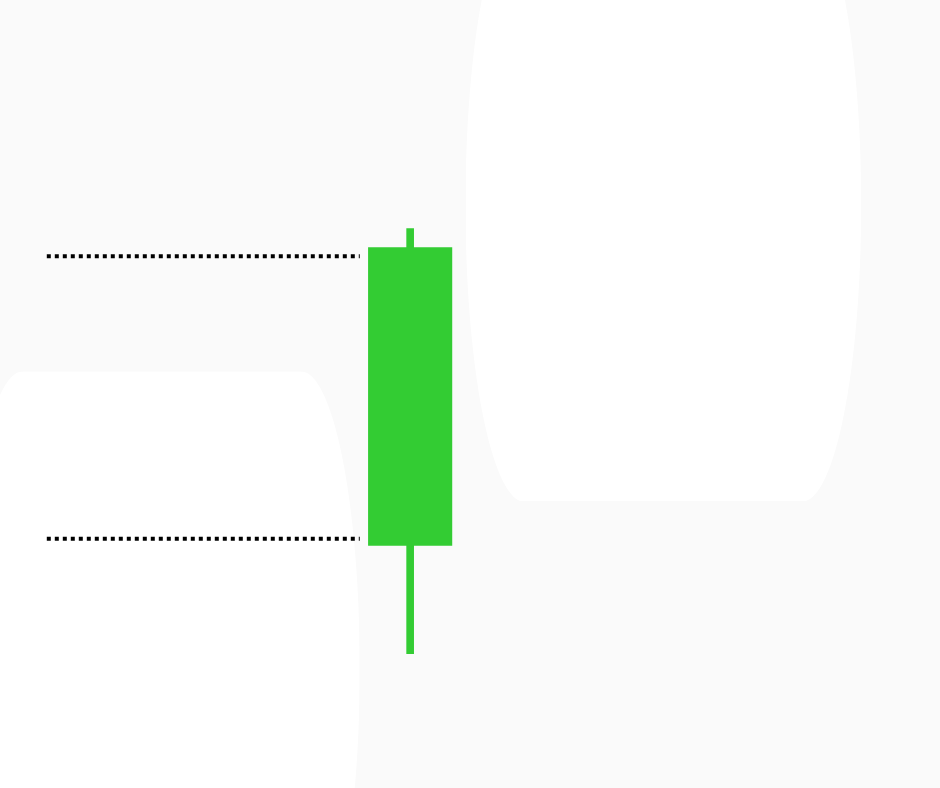
For a selected interval, a candle records:
- Open: first recorded price in the interval.
- High: highest recorded price.
- Low: lowest recorded price.
- Close: last recorded price.
The thick body connects open and close. The thin upper and lower wicks reach the high and low. Chart colors are settings, not laws. Commonly, green means close above open and red means close below open, but always check the legend.
A fictional candle
Suppose a one-hour candle has:
- open ₱100;
- high ₱108;
- low ₱97;
- close ₱105.
The body runs from ₱100 to ₱105. The upper wick runs from ₱105 to ₱108; the lower wick from ₱100 to ₱97. The range is ₱11 and the body is ₱5.
This tells us the path reached both ₱97 and ₱108 before finishing above the open. It does not reveal the exact sequence of every trade. High could have occurred before or after low. A candle compresses information.
One candle versus context
Ask four questions:
- Where is the candle relative to prior structure?
- Is its range unusual versus recent candles?
- Did volume or liquidity change?
- What did the next candles confirm or invalidate?
A small-body candle after a long rally may mean hesitation; the same shape in a quiet range may be ordinary. Names such as doji, hammer or engulfing pattern are labels for geometry. They are not automatic orders.
Timeframe and the 24/7 boundary
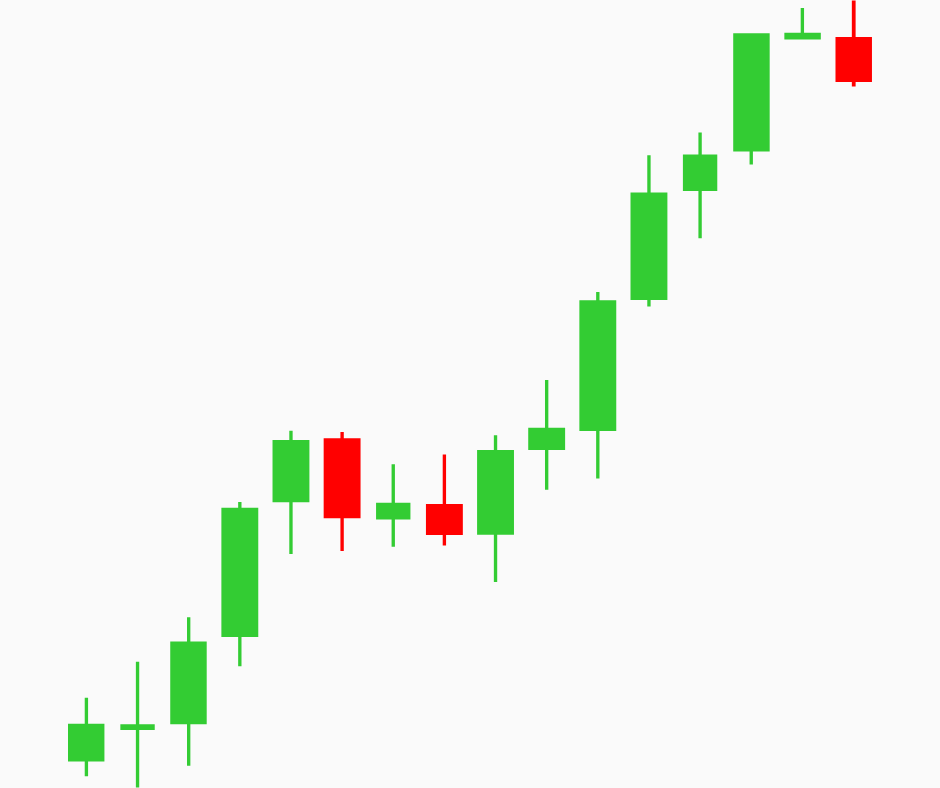
On a one-hour chart, each candle covers an hour; on a daily chart, a day. Because crypto trades continuously, the “daily open” depends on the provider’s time-zone boundary and price source. Two valid providers can show different wicks.
Always record:
- pair and venue or index;
- timeframe;
- time zone;
- whether the current candle is complete.
An unfinished candle can change dramatically before its close.
Heikin-Ashi and other transformed candles
Some chart types transform prices to smooth trends. Heikin-Ashi open and close values, for example, are calculated values rather than the market’s raw OHLC for that interval. These charts can aid visualization but should not be mistaken for directly executable prices.
Check the chart type before reading or backtesting.
A familiar Philippine or Asian example
A learner opens a historical BTC/USDT or BTC/PHP chart and records the venue, symbol, timeframe, time zone and candle-completion state. They mark one observation, one confirmation condition, one invalidation point and one alternative explanation. No live order is placed.
One risk or limitation
Technical tools summarize historical price, volume or derived data. They can lag, overfit and fail during regime changes, illiquidity, outages or news shocks. A chart pattern or indicator never guarantees direction, execution or profit.
How this connects to market mastery
Market mastery uses chart evidence conditionally. A useful technical plan states the context, confirmation, invalidation, cost and failure condition before any outcome is known.
Quick check — no money needed

Choose a historical chart with its symbol, venue and timeframe visible. Mark the setup’s context, observation, confirmation, invalidation and one common mistake. Explain what evidence would show that the tool is unreliable in this example.
If you can explain your answer and name the invalidation or main limitation, this lesson is complete.


