
Why you should know this
A tool that behaves reasonably in a steady trend may struggle in a choppy range. A breakout plan assumes something different from a mean-reversion plan. Before choosing a technique, we need a shared language for what price has been doing.
The labels are maps, not laws. Markets do not read our textbooks. The useful habit is to say what evidence supports a label and what would make us change it.
Trend: movement with directional structure
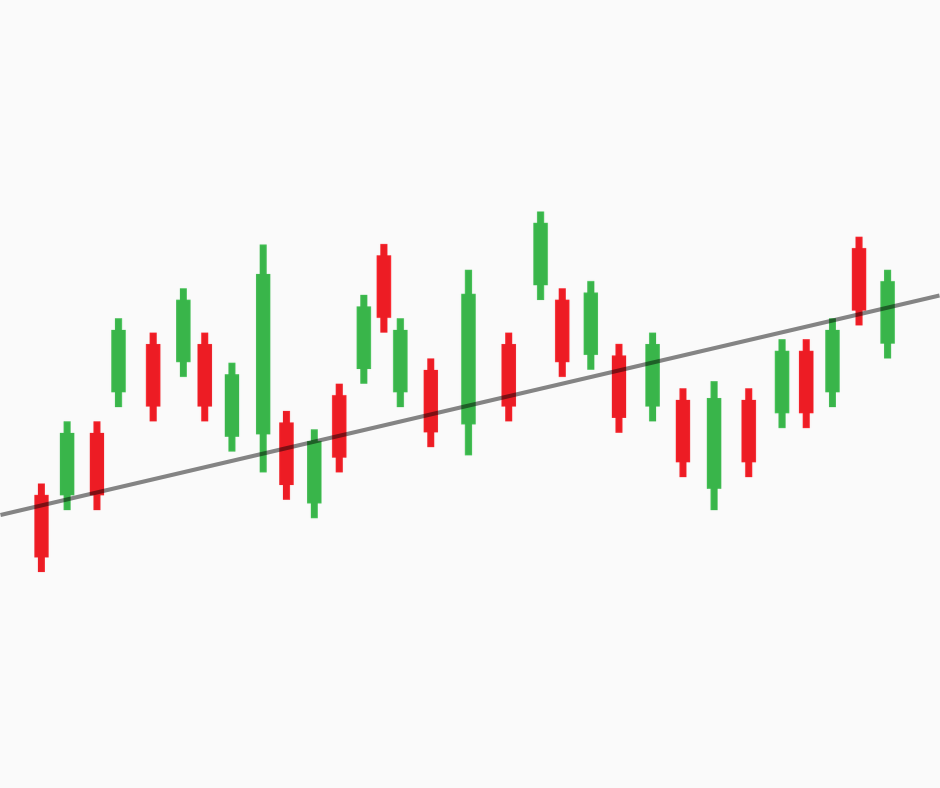
An uptrend is commonly described by rising swing highs and rising swing lows. A downtrend shows falling swing highs and falling swing lows. The exact swings depend on timeframe and method.
Trend does not mean price moves in a straight line. An uptrend contains declines; a downtrend contains rallies. The question is whether those moves preserve or damage the observed structure.
Good description: “On the daily chart, three meaningful swing lows have risen and price remains above the prior breakout area.”
Weak description: “It always goes up.”
Range: repeated trade between boundaries

A range develops when price rotates between an upper area and lower area without sustained progress. Boundaries are usually zones, not perfect lines.
Inside a range:
- price may reject near the edges;
- activity may concentrate around a central value area;
- false moves outside the boundary can occur;
- volatility can contract before expansion, but does not have to.
Calling a market “sideways” does not make it safe. Thin liquidity or sudden news can produce violent movement even after a quiet period.
Breakout: acceptance beyond a meaningful boundary

A breakout is more than a candle wick touching a line. It is an attempt to move beyond an established zone. Analysts may look for some combination of:
- a close beyond the boundary on the decision timeframe;
- increased participation or volume;
- follow-through rather than immediate rejection;
- a successful retest;
- supportive movement in related markets.
None guarantees success. The confirmation rule should be chosen before the outcome.
Failed breakout: the market says “not yet”

A failed breakout moves beyond a boundary and then returns inside. Failure can trap traders who chased the first move, but we cannot know every participant’s position from the chart.
Define failure carefully. Is it a close back inside the range? A move through the opposite edge? A time limit with no follow-through? Different definitions produce different results.
Sometimes the best lesson is not “the breakout was fake.” It is “my rule accepted too little evidence for the risk I was taking.”
Reversal versus pullback
A pullback temporarily moves against an existing trend while its defining structure remains intact. A reversal changes that structure and begins to establish movement in the opposite direction.
Imagine a daily uptrend. One red candle is not automatically a reversal. Analysts may watch for:
- loss of a meaningful higher low;
- failure to recover;
- formation of a lower high;
- broader confirmation from volume, liquidity or context.
By the time a reversal is clear, the exact top or bottom may be gone. That is normal. Confirmation trades early certainty for better evidence.
Transition: the honest middle category
Markets often sit between labels. A trend loses momentum, becomes choppy, enters a range and later breaks. Forcing a transition into “bull” or “bear” can create false precision.
“Transition/unclear” is a valid classification. It may justify smaller hypothetical exposure, different tactics or simply observation. Survival sometimes begins with permission not to have a strong view.
A classification table
| State | Observable evidence | Example invalidation |
|---|---|---|
| Uptrend | Rising defined swings | Break and acceptance below a defining higher low |
| Downtrend | Falling defined swings | Break and acceptance above a defining lower high |
| Range | Repeated rotation between zones | Sustained acceptance outside a boundary |
| Breakout attempt | Movement beyond a known zone | Return and close inside under the stated rule |
| Reversal candidate | Trend damage plus opposite structure | Recovery of the damaged structure |
| Transition | Conflicting or incomplete evidence | New, stable structure becomes observable |
“Acceptance” and “meaningful” must be defined by timeframe and rule. They are not magic words.
Philippine and Asian context

For a PHP-based reader, a crypto chart in USD and the final PHP outcome can differ when USD/PHP moves. A token might appear flat in USD while rising in PHP terms. State which pair owns the analysis.
Activity around US, European and Asian business hours can also affect liquidity and reaction speed, even though crypto itself trades continuously. Do not label a move a “Tokyo breakout” merely because the clock says Tokyo; verify data and relevant catalysts.
Common mistakes
- Drawing a trend from two convenient points.
- Treating exact horizontal prices as unbreakable walls.
- Calling every new high a confirmed breakout.
- Declaring a reversal from one candle.
- Moving boundaries after seeing the result.
- Mixing pairs or timeframes in the same label.
- Refusing to use “unclear.”
A no-money state lab
Use three frozen historical charts. For each, write:
- pair, timeframe and end date;
- current state;
- two observable facts supporting it;
- one alternative interpretation;
- one invalidation condition;
- confidence: low, medium or high, with a reason.
Reveal the next ten candles only after recording the answer. Score the quality of the process, not whether the direction happened to be right.
How this connects to market mastery
Technical analysis, strategy selection and risk controls all depend on the assumed market state. Fundamental catalysts can change that state; liquidity can distort it; sentiment can accelerate it. Mastery is not perfect labeling—it is updating responsibly when the evidence changes while preserving the original record.
Key takeaways
- Trends use directional structure; ranges use recurring zones.
- A breakout needs a predefined confirmation rule.
- A pullback and reversal are different claims.
- “Transition” is useful when evidence conflicts.
- Every label needs a timeframe, evidence and invalidation.
Completion check: Classify three frozen charts and state what would prove each classification wrong.


