
Why you should know this
A five-minute chart can show a sharp rally while the daily chart remains in a long decline. Neither chart is necessarily wrong. They summarize different slices of time.
Timeframe discipline matters from the first lesson to market mastery because entries, risk, expectations and reviews need the same clock. If the idea is based on a weekly trend but fear is triggered by every one-minute candle, the plan and the attention span are fighting each other.
What a timeframe means
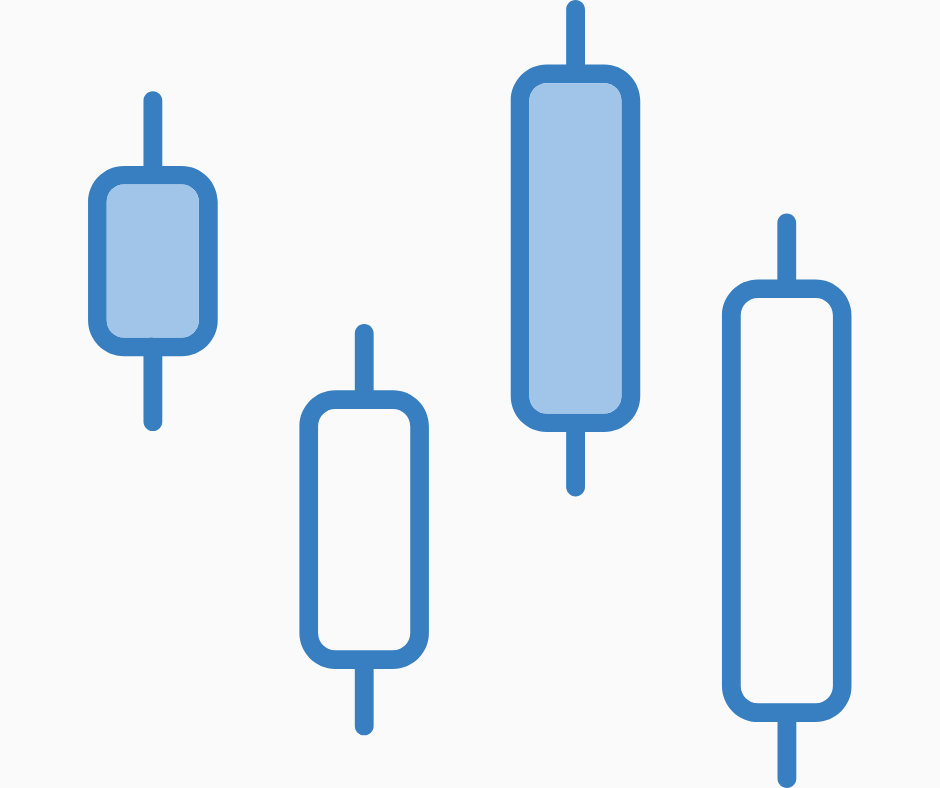
On a one-hour candlestick chart, each candle usually summarizes one hour’s open, high, low and close. On a daily chart, each candle summarizes a day. Providers can differ in session cutoffs, time zone, price source and treatment of missing data, so two charts may not be identical.
Crypto trades continuously on many venues. A “daily close” is therefore a chosen data boundary, not a universal market shutdown. Record the provider and time zone when precision matters.
Common timeframe families
| Horizon | Typical chart views | Best question |
|---|---|---|
| Structural | Monthly and weekly | What is the long market history and major regime? |
| Swing/context | Daily and four-hour | What trend, range or major level frames the next days or weeks? |
| Tactical | One-hour and 15-minute | Where is current activity within that larger context? |
| Very short term | Five-minute and below | How is immediate execution behaving? |
These are not mandatory rules. A remittance converter, long-term investor and active trader have different tasks. The correct timeframe is the one that matches the decision and the person’s ability to monitor and manage risk.
Use three roles, not three predictions

A practical structure is:
- Context timeframe: shows the broader market environment.
- Decision timeframe: contains the setup or condition that matters.
- Execution timeframe: helps plan an order without erasing the larger thesis.
For a fictional swing idea, weekly might be context, daily the decision chart and four-hour the execution chart. For a long-term research allocation, monthly, weekly and daily may be more suitable. Adding a one-minute chart would add noise, not necessarily insight.
What timeframe conflict really means
Suppose:
- weekly: higher highs and higher lows;
- daily: a two-week decline;
- one-hour: a small rebound.
A careful description is: “The longer trend is rising, the daily market is correcting, and the intraday market is bouncing.” It is not necessary to force one word—bullish or bearish—onto all three.
Conflict is information. It can mean the market is pulling back inside a larger trend, transitioning between regimes or simply moving normally at several scales. It may also mean the planned holding period is unclear.
Match risk to the decision timeframe

If the setup is defined on the daily chart, an invalidation point normally relates to daily structure. A stop placed according to a one-minute wiggle may be too close for that idea. Conversely, using a weekly invalidation for a tiny intraday target can create disproportionate risk.
Timeframe does not determine the amount of money to risk. Position size must adapt to the distance between entry and invalidation, affordable capital and the wider risk plan.
Timeframes for practical crypto use
Not every reader is trading. A Filipino family converting a transfer may use:
- daily or four-hour context to see whether the market is unusually unstable;
- a short execution view to inspect spread and slippage;
- a service deadline as the real decision horizon.
If school fees are due tomorrow, waiting for a perfect weekly chart may be irrelevant. The practical objective should lead.
Avoid timeframe tourism

Timeframe tourism happens when we move from chart to chart until a desired answer appears. Common signs include:
- the daily setup fails, so the weekly story is used to avoid admitting it;
- a long-term investment is sold because of one red five-minute candle;
- a short-term trade becomes a “long-term hold” after it loses;
- indicators use different timeframes without a stated hierarchy.
The cure is simple but not always easy: write the horizon before looking for confirmation.
A TIMEFRAME card
Before analysis, record:
- Task: trade, convert, invest, observe or learn.
- Intended horizon: minutes, days, months or another defined period.
- Main chart: where the decision is made.
- Environment chart: one or two levels higher.
- Execution chart: only if it helps the task.
- Failure condition: what would invalidate the idea.
- Review time: when the plan is reassessed.
This card prevents the clock from changing after emotion enters.
Common mistakes
- Assuming lower timeframes are more accurate because they contain more candles.
- Assuming higher timeframes cannot change.
- Comparing daily candles with different time-zone cutoffs.
- Using an execution chart to rewrite a context thesis.
- Monitoring far more frequently than the plan requires.
- Choosing a timeframe based on excitement rather than purpose.
A no-money three-window lab
Choose a historical crypto chart and freeze the end date so future candles are hidden. Write one factual sentence for the weekly, daily and four-hour views. Then answer:
- What is the task?
- Which chart owns the decision?
- What apparent conflict exists?
- Does that conflict invalidate the idea, delay it or merely describe a pullback?
Do not decide whether to buy or sell. The goal is consistent observation.
How this connects to market mastery
Technical indicators, market structure, breakouts and backtests all change when the timeframe changes. Fundamental developments may unfold over months while execution risk appears in seconds. Mastery is the ability to keep those clocks related without mixing them. A simple timeframe card can be more valuable than another indicator.
Key takeaways
- A timeframe is a data window, not a quality score.
- Continuous crypto trading makes daily cutoffs provider-specific.
- Use context, decision and execution roles.
- Apparent conflict can be described without forcing a single verdict.
- Set the horizon before the chart tempts you to change it.
Completion check: Prepare a three-timeframe observation with a fixed task, main chart, failure condition and review time.


