
Why you should know this
“The fill looked bad” is a feeling. Execution quality needs a benchmark, timestamp, side, quantity and cost record.
Measurement helps traders choose order types, size positions and compare routes. It also protects against false confidence: a profitable trade can have poor execution because the market later moved favorably, while a losing trade can have excellent execution against a falling market.
Begin with the decision record
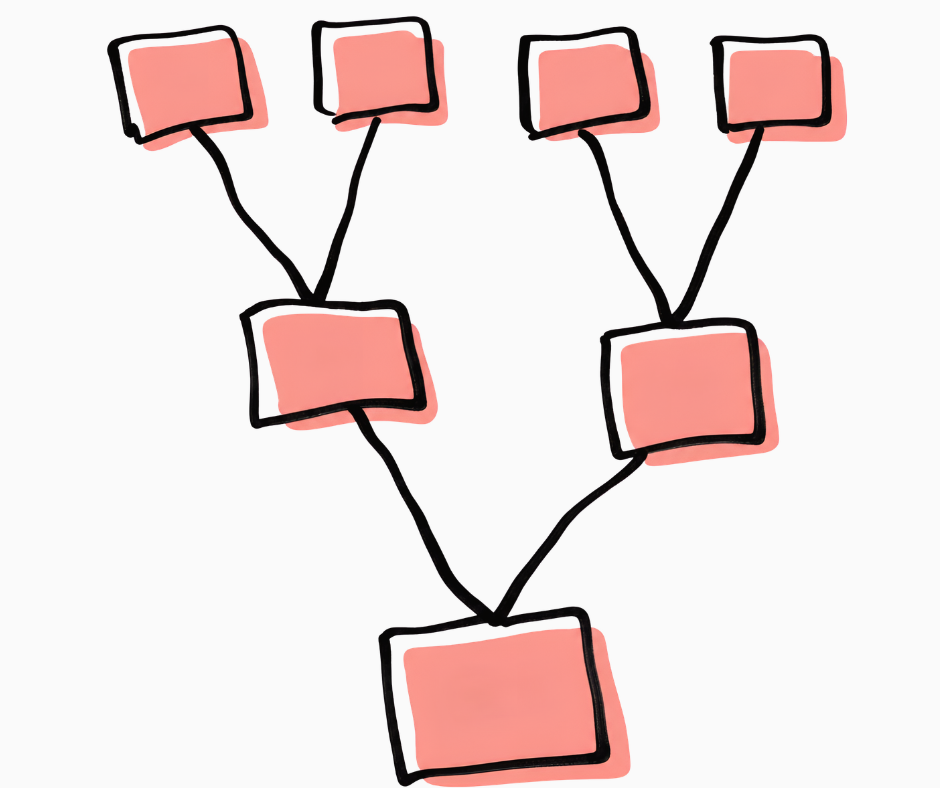
Capture before submission:
- pair and venue;
- buy or sell;
- intended quantity;
- decision timestamp;
- best bid, ask and midpoint;
- visible depth;
- order type and limit;
- expected fees;
- reason and urgency.
After execution, capture every fill, fee, remainder, cancellation and final usable amount. Without the before-state, most cost analysis becomes guesswork.
Average fill price
For multiple fills:
Average fill = Sum of price × quantity ÷ Total filled quantity
Example buy:
- 200 units at ₱100;
- 300 at ₱101;
- 500 at ₱102.
[(200 × 100) + (300 × 101) + (500 × 102)] ÷ 1,000 = ₱101.30
Do not use the simple average of 100, 101 and 102; quantities differ.
Fill rate

Fill rate = Filled quantity ÷ Intended quantity × 100
If 1,000 of an intended 1,500 units execute:
1,000 ÷ 1,500 × 100 = 66.67%
A high fill rate is useful when completion matters. It can be poor if achieved at an unacceptable price. A low fill rate can be prudent if a limit protected the boundary.
Slippage against arrival price
Suppose the best ask when the buy order arrives is ₱100 and average fill is ₱101.30:
(₱101.30 − ₱100) ÷ ₱100 × 100 = 1.30%
This measures cost beyond the selected ask benchmark. If using midpoint, document that instead.
Effective spread
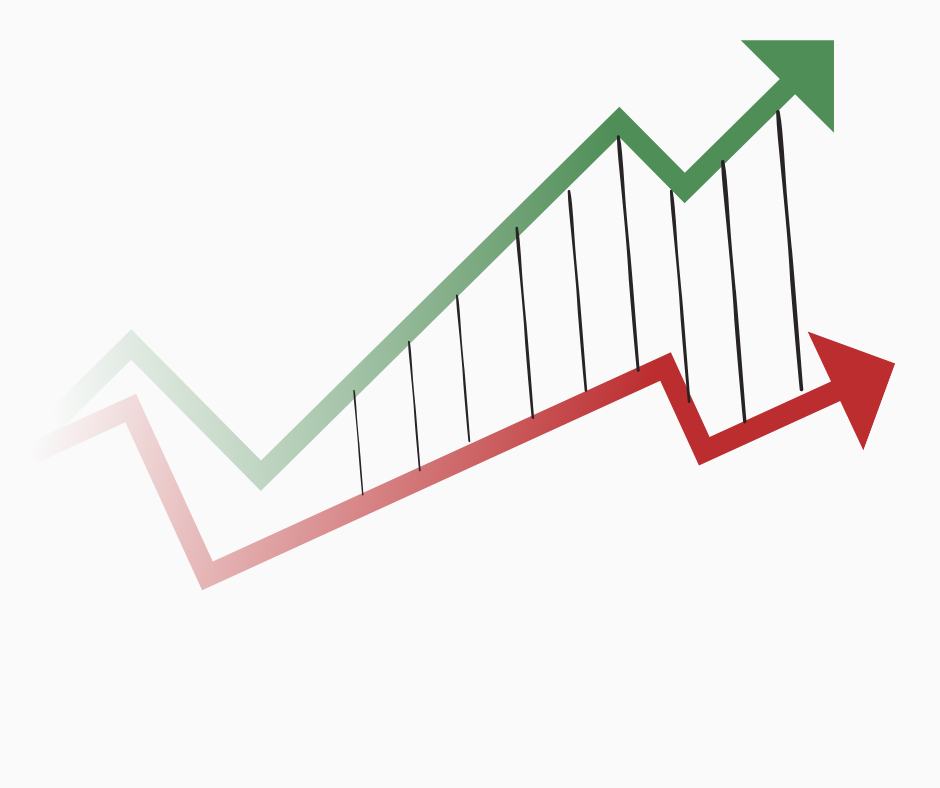
Effective spread compares execution with the midpoint near execution. A common form is:
Effective spread = 2 × Direction × (Fill price − Midpoint)
Use Direction = +1 for buys and −1 for sells so a positive result represents cost.
If midpoint is ₱99.50 and buy fill is ₱100:
2 × 1 × (100 − 99.50) = ₱1.00
As a percentage of midpoint:
₱1 ÷ ₱99.50 × 100 ≈ 1.01%
This estimates the round-trip spread implied by the execution relative to midpoint. It is not the same as total cost.
Price improvement
If a marketable buy arrives with best ask ₱100 but fills at ₱99.90, price improvement versus the ask is ₱0.10 per unit.
Record the applicable benchmark and quantity. A venue should not be praised from one fill; comparable samples and consistent methodology are needed.
Implementation shortfall
Implementation shortfall compares the paper portfolio implied by the decision price with what was actually executed, including unexecuted quantity under a defined valuation.
A simplified buy example:
- intended: 1,500 units;
- decision price: ₱100;
- filled: 1,000 at ₱101.30;
- 500 unfilled, later valued at ₱103;
- explicit fee: ₱300.
Execution cost on fills:
(₱101.30 − ₱100) × 1,000 = ₱1,300
Opportunity cost on unfilled quantity:
(₱103 − ₱100) × 500 = ₱1,500
Simplified shortfall:
₱1,300 + ₱1,500 + ₱300 = ₱3,100
As a percentage of intended decision value of ₱150,000:
₱3,100 ÷ ₱150,000 × 100 ≈ 2.07%
The valuation time for the unfilled amount must be defined. Different choices answer different questions.
Markout and adverse selection
A markout compares the fill with a later midpoint, for example after one minute or five minutes.
If a maker buys at ₱100 and the midpoint one minute later is ₱98, the fill looks adversely selected. If it rises to ₱102, the fill looks favorable.
Choose intervals that fit the strategy. A one-minute markout is not a verdict on a one-year investment.
Speed and latency

Record:
- decision-to-submit time;
- submit-to-acknowledgement time if available;
- acknowledgement-to-fill time;
- total completion time.
Faster is not always better. A patient maker expects waiting. An urgent conversion may value completion. Compare speed only among similar order objectives.
Explicit and final-route cost
Add:
- maker/taker fees;
- financing or funding where applicable;
- network or transfer fees;
- conversion and Withdrawal cost;
- taxes only with qualified analysis.
For a Philippine user, the final score may be usable PHP received ÷ starting crypto quantity, not simply the crypto fill price.
A balanced scorecard
| Dimension | Metric | Question |
|---|---|---|
| Price | Average fill, slippage, effective spread | What price did we receive? |
| Quantity | Fill rate, remainder | How much completed? |
| Time | Completion and cancellation time | Did it meet the task? |
| Cost | Fees, financing, transfer | What was paid beyond price? |
| Impact | Worst level, markout | Did our order or informed flow move against us? |
| Operations | Rejections, status, Withdrawal | Did the route complete reliably? |
No single column should dominate every decision.
Compare like with like
Do not compare:
- a small market order with a large staged program;
- a liquid BTC pair with a thin token;
- an urgent remittance conversion with a patient maker quote;
- calm-hour trades with news-event trades;
- venues without including transfer, custody and final-route cost.
Group observations by pair, size bucket, side, volatility, order type and purpose.
Data-quality cautions

Exchange timestamps may use different clocks. Screenshots can omit updates. Order books change between capture and arrival. Unfilled orders need a defined opportunity-cost valuation.
Preserve raw reports where possible and state every assumption. Precision in a spreadsheet cannot repair a weak benchmark.
Philippine and Asian context

Execution quality for a PHP user can differ from a global USDT benchmark. Local depth, FX, bank availability and final Withdrawal affect value.
When comparing providers, do not claim “best execution” from one price screenshot. Use repeatable samples, consistent sizes, identical final assets and current terms. Comparative public claims require Compliance/Legal and methodology review.
The QUALITY review
- Q — Quantity: intended, filled and remaining.
- U — Unit: base, quote and final usable currency.
- A — Arrival: bid, ask, midpoint and timestamp.
- L — Levels: average and worst fill through depth.
- I — Included costs: fees, funding, transfer and Withdrawal.
- T — Time: acknowledgement, fill and completion.
- Y — Yield no excuses: compare process, not only profit or loss.
Common mistakes
- Using last price without side or timestamp.
- Averaging fills without quantity weights.
- Ignoring unfilled opportunity cost.
- Calling fast execution good despite poor price.
- Comparing different pairs and sizes as if identical.
- Excluding transfer and final PHP costs.
- Declaring venue superiority from a tiny sample.
- Changing benchmarks after seeing the result.
A no-money execution lab
Use the 1,500-unit example. Recalculate shortfall if the unfilled 500 is later valued at ₱99 instead of ₱103. Then compare a full fill at ₱102 with the partial fill.
State which result is better for an urgent task and for a patient price-controlled task. The answer can differ because objective belongs in the scorecard.
How this connects to market mastery
Execution measurement closes Academy 5. We began by reading pairs and end by evaluating the full path from decision to usable result.
Academy 6 will study market direction. This scorecard prevents directional analysis from absorbing every success and failure. Mastery gives execution its own evidence.
Key takeaways and check
- Record the benchmark before the order.
- Weight fills by quantity and calculate fill rate.
- Slippage, effective spread and implementation shortfall answer different questions.
- Include explicit fees, opportunity cost and the final route.
- Compare only similar orders with a stable methodology.
Advanced Trader check: Calculate all five core metrics in the simplified example and explain how changing the unfilled-quantity valuation changes shortfall.


