
Why you should know this
Blockchains produce abundant public data. That can feel like perfect transparency. In reality, the ledger records addresses, transactions and contract events—not neat labels such as “one Filipino remittance user.”
The analytical task is to move carefully from observable activity to a limited conclusion. Strong market readers combine several metrics, document definitions and keep alternative explanations alive. This discipline matters from the first dashboard to advanced valuation.
Address is not wallet is not person

One person can control many addresses. An exchange address can represent many customers. Smart contracts, bots and bridges can also appear as active addresses. Some blockchain designs encourage new addresses for privacy or operational reasons.
Therefore, “active addresses” usually means addresses meeting a provider’s activity rule during a period. It does not equal unique humans. If a dashboard publishes an entity-adjusted user estimate, inspect its clustering method and confidence.
Transaction count

Transaction count can show whether a network is being used, but it needs context:
- What counts as one transaction?
- Are failed transactions included?
- Are internal contract calls counted?
- Is activity dominated by one application?
- How cheap is it to generate transactions?
- Are bots, spam or self-transfers filtered?
A high-cost settlement chain and low-cost gaming chain can serve different jobs; comparing their raw counts may tell us little about success.
Transfer value and economic value
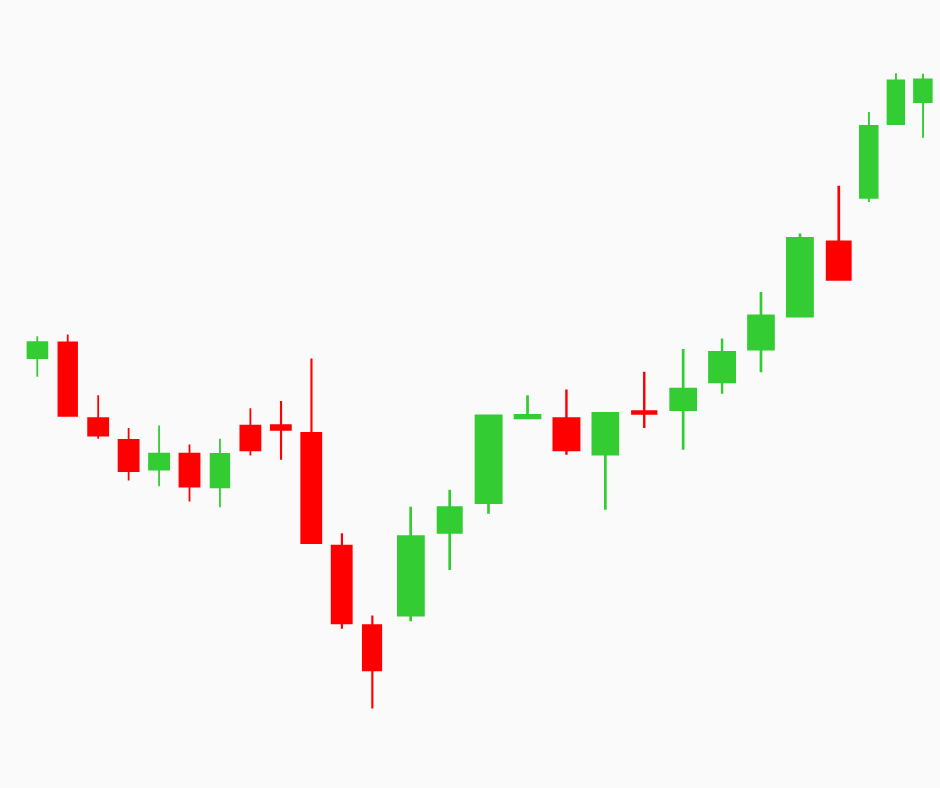
Gross transfer value can be inflated by exchange reshuffling, bridge movements, self-transfers, change outputs and repeated movement of the same funds. “Adjusted” value depends on a methodology that may classify entities or remove patterns.
For practical payments, final settlement amount, recipient access and repeat use may be more meaningful than gross token movement. Stablecoin transfer value can be relevant, but it does not automatically reveal whether the purpose was remittance, trading, treasury management or decentralised finance.
Fees reveal willingness to pay—with caveats

Fees can indicate demand for limited block space or application services. Ask:
- Who pays the fee?
- Is it paid by the user or subsidised?
- Does it go to validators, burn, a protocol treasury or another party?
- Is congestion making the product less usable?
- Are fees denominated consistently?
Higher fees can signal demand, but they can also damage user experience. Lower fees can support accessibility, yet may produce less economic security or revenue. Context wins.
Retention and cohorts

New-address growth can be purchased with an airdrop. Retention asks whether participants return after the promotion.
Useful cohort questions include:
- What proportion is active after 7, 30 or 90 days?
- Do users complete the product’s intended action again?
- Does activity remain after rewards decline?
- Are returning users concentrated in a few automated actors?
True user retention may require application analytics that cannot be derived from public addresses alone. State the boundary.
Distribution and resilience

Adoption quality also concerns concentration:
- activity across applications;
- geographic accessibility, where lawfully measurable;
- validator and infrastructure diversity;
- stablecoin, bridge or oracle dependencies;
- share of fees or volume from the top actors;
- continuity during congestion or an outage.
A network dependent on one application or incentive source may be active but fragile.
Build a balanced dashboard
Use at least four lenses:
| Lens | Example measure | Main caveat |
|---|---|---|
| Activity | Active addresses, transactions | Addresses are not people |
| Economic | Adjusted value, fees | Filtering and attribution |
| Retention | Returning cohorts | Bots and incomplete identity |
| Distribution | Concentration by app/entity | Labels may be incomplete |
| Product outcome | Completed transfers or actions | May require off-chain data |
| Resilience | Success rate during stress | Incident definitions differ |
Display the date, unit, chain, data provider, transformation and known exclusions for every chart. Compare like with like.
A useful inference ladder
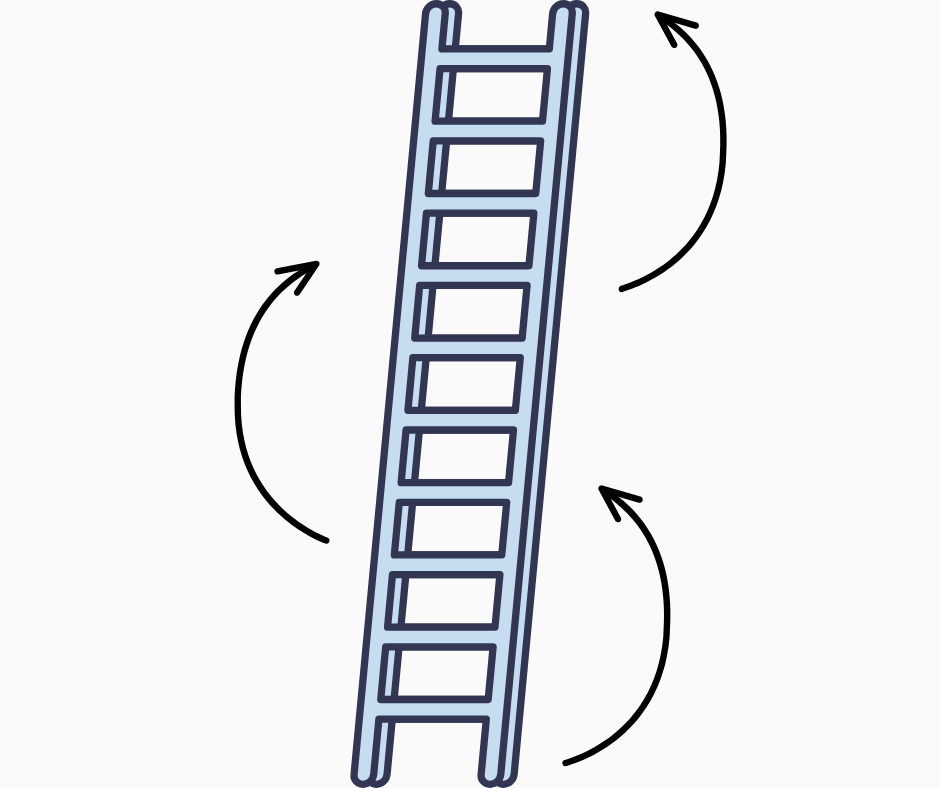
Move one rung at a time:
- Observation: Daily active addresses rose under definition X.
- Context: An incentive campaign began during the same period.
- Hypothesis: The campaign may have attracted new activity.
- Test: Examine retention, unique funding sources and post-campaign behaviour.
- Limited conclusion: Activity increased, but durable human adoption remains unproven.
This sounds less exciting than “mass adoption,” and it is much more useful.
Common mistakes
- Equating addresses with people.
- Ranking unlike networks by raw transactions.
- Calling gross transfers economic volume.
- Ignoring subsidies, failed calls and spam.
- Using one peak day as a trend.
- Mixing data providers without reconciliation.
- Treating correlation with price as proof of causation.
A no-money adoption lab
Create four fictional weeks of addresses, transactions, fees and 30-day retention. Add an incentive campaign in week two and remove it in week four. Write:
- the observation;
- two competing explanations;
- the metric that would distinguish them;
- the strongest conclusion the data permit;
- one conclusion they do not permit.
How this connects to market mastery
Adoption metrics connect real-world utility to protocol economics. They prepare you to ask whether fees represent durable demand, whether developers support continued use and whether value reaches a token. Market mastery grows when every impressive chart comes with a quiet question: “What exactly are we counting?”
Key takeaways
- Public ledgers show activity, not certain human identities or purposes.
- Use several activity, economic, retention and distribution measures.
- Incentives and bots can manufacture impressive counts.
- Methodology, time and unit belong beside every metric.
- Strong conclusions move carefully from observation to tested explanation.
Completion check: Build a fictional dashboard and identify two conclusions it cannot support.
Next lesson: A08-06 distinguishes protocol fees, revenue and token-holder value accrual.


